Post Vaccine Syndrome Survey Results
Post-Vac-Syndrome Germany is an organization with over 1500 members affected by Post COVID Vaccination Syndrome, which focuses on medical and scientific understanding of these diseases. Our friends at Post-Vac Syndrome Germany have completed a survey of almost 800 of those affected, which we have translated here for an English-speaking audience. In addition to the final analysis, we have also provided the machine translated English PVS Survey.
In addition to research, their group maintains a list of injured stories and a German FAQ (Frequently Asked Questions) for the injured who are looking for answers and support.
Therefore, further questions can be discussed with the raw data: We are happy to make the raw data of the survey available to scientists and institutes. Requests for this can be sent to: webmaster@nebenwirkungen-covid-impfung.org

Sections:
1.0 General Information | 1.1 Breakdown of Participants 2.0 Demographics 3.0 Pre-Existing Illnesses | 3.1 Pre-existing conditions among respondents | 3.2 Type of Previous Illness 4.0 Side Effects After 1st Vaccination | 4.1 Vaccine Manufacturer | 4.1.1 Onset of long-term side effects after 1st vaccination | 4.2 Summary: Symptoms and symptom groups | 4.3 Symptom groups in detail | 4.3.1 Neurological | 4.3.2 Mobility Symptoms | 4.3.3 Cardiovascular | 4.3.4 Eye | 4.3.5 Digestion | 4.3.6 Nephrological | 4.3.7 Psychological | 4.3.8 Respiratory | 4.3.9 Skin | 4.3.10 Immune system | 4.3.11 General conditions 5.0 Final questions | 5.1 GPCR autoantibodies prevalence | 5.2 Reporting of side effects | 5.3 Emergency room stay | 5.4 Activity level before 1st vaccination | 5.5 Physical activity level before vaccination | 5.6 Performance limitation after 1st vaccination |1. General Information
Surveys completed in full: 777
- Start of survey: 20.02.2022
- End of the survey: 30.06.2022
- Type of survey: online survey, which was shared exclusively in private stakeholder groups as well as in the non-public area of the PVS forum.
- As can also be seen from the questionnaire, only a portion of the questions and data were evaluated. Therefore, further questions can be discussed with the raw data.
- No conclusions can be drawn from the survey about the prevalence of PVS among vaccinated individuals in the population.
- The survey cannot prove causality between symptom occurrence and vaccination.
- If a sufficiently large population is vaccinated, it is also to be expected that vaccinated persons develop certain diseases or symptoms, which only correlate temporally with the vaccination, but whose actual cause does not lie in that vaccination.
- However, the closer the time of vaccination and the occurrence of symptoms are in time, the more likely a causal relationship becomes.
- The respondents indicated that 57.4% developed the symptoms within one week and another 21.4% within 1-2 weeks after vaccination. (4.1.1).
- The temporal proximity between vaccination and complaint onset therefore also strongly suggests a causal relationship! This assumption is further supported by the strongly similar symptoms of the affected persons (cf. 4.2.).
- The medical examination is the responsibility of the Paul Ehrlich Institute, which must evaluate the reported suspected cases in this regard.
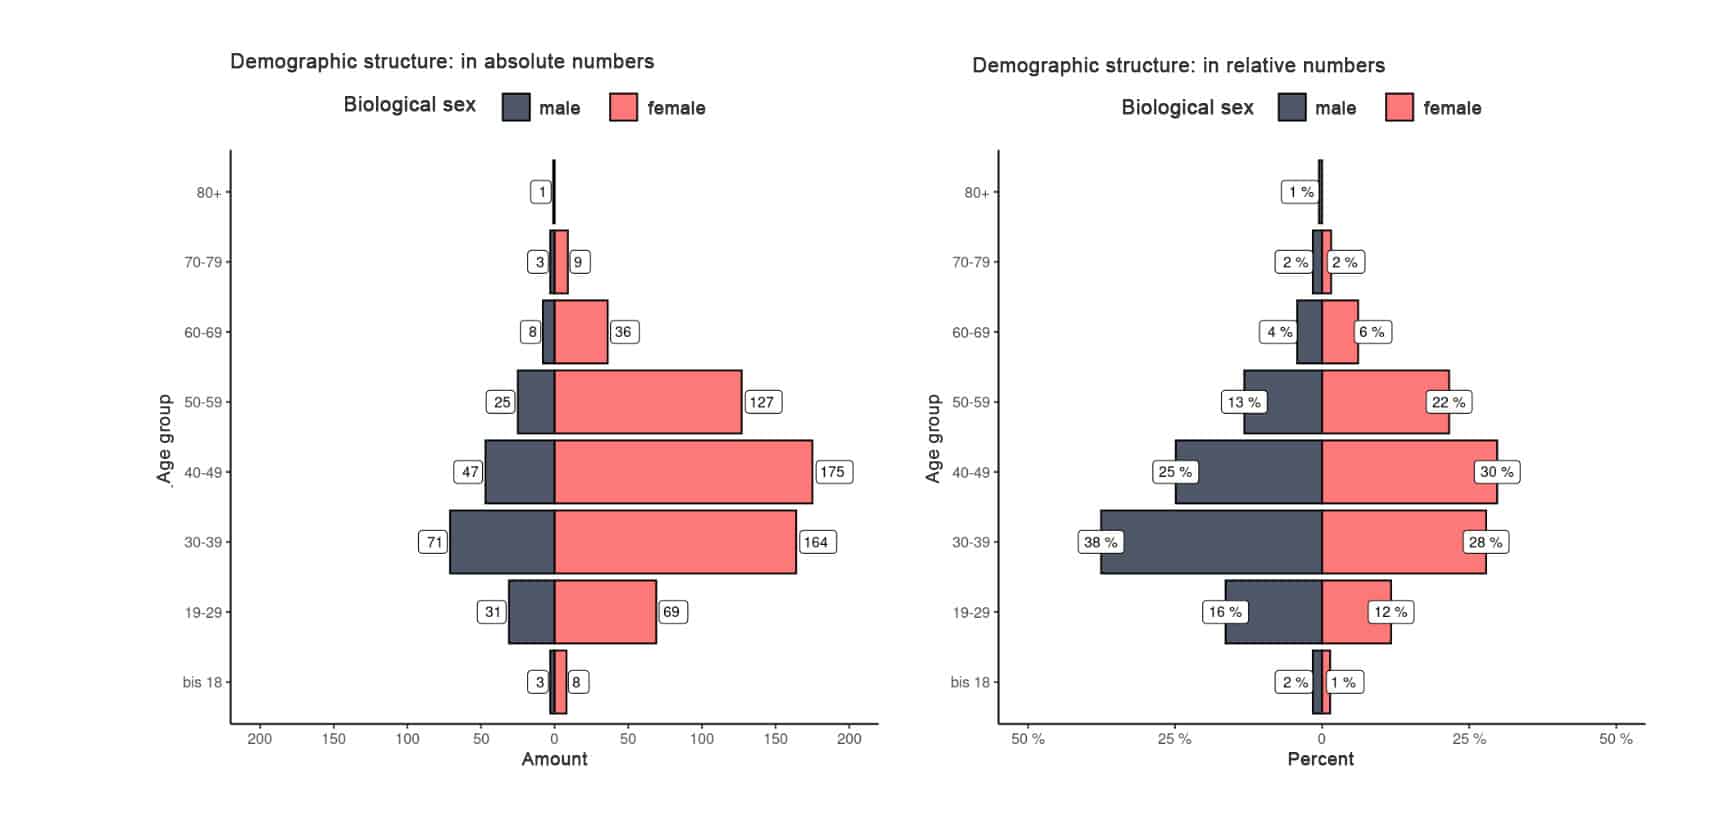
- Since the survey was conducted online, it can be assumed that people without Internet affinity are underrepresented in the survey; this could affect older people, for example.
3. Pre-Existing Illnesses
Note: The previous illnesses queried are only shown for the sake of completeness. Due to the lack of a control group of vaccinated individuals without PVS problems, no statement can be made as to whether certain pre-existing conditions occur more frequently in people suffering from PVS and could thus potentially promote PVS.
Despite the lack of a control group, the results should not remain completely unclassified and therefore a comparison with pre-existing conditions occurring in the population should be drawn:
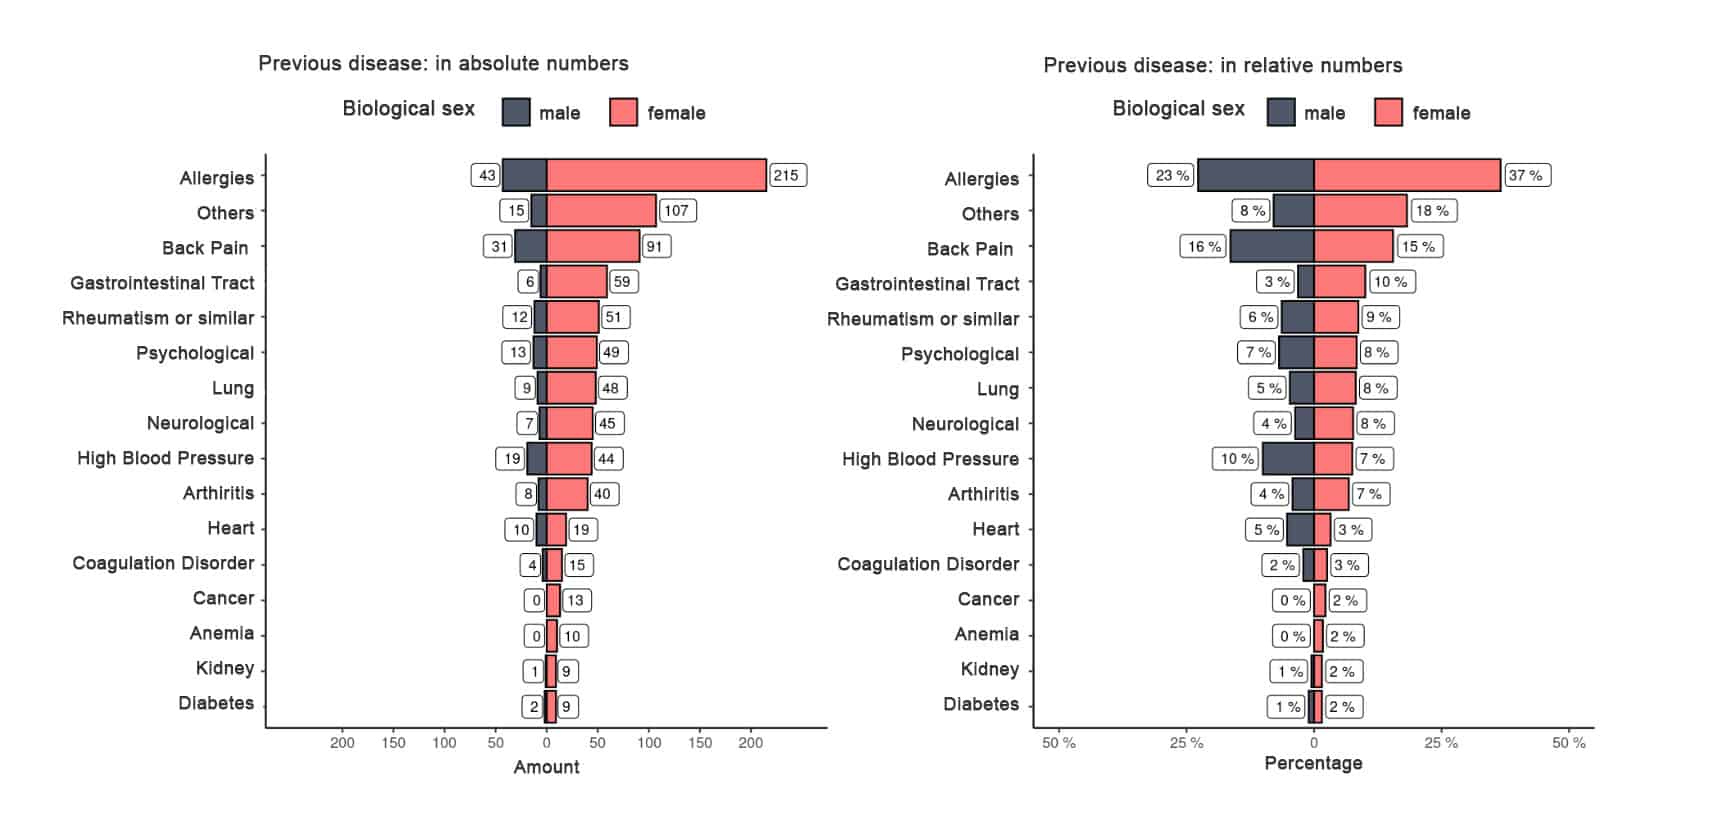
For example, 37% of female respondents in the PVS survey reported suffering from an allergy . For men, this was 23%. In the RKI Journal of Health Monitoring 2017, 31.6% of the women surveyed said they suffered from an allergy. For men, this was 24.5% ( RKI 2017, p.2 ). The magnitude of previously ill people with allergies can therefore be compared with the results from this PVS survey.
In the RKI Journal of Health Monitoring 2021, 66% of female respondents reported being affected by back pain, compared to 56.4% of men. (RKI 2021 ,P.5). The results of the PVS survey are significantly lower.
The pre-disease diabetes was 2% in women and 1% in men in the PVS survey. The German Diabetes Society states the prevalence of diabetes in the adult population at 9-10%. (DDG 2021, P.9)
The RKI gives the prevalence of depression as 7.1% in the population. (RKI, Physische Gesundheit in Deutschland, p.39) In the PVS survey, pre-existing conditions in the entire area of psychological conditions were given as 7% and 8%.
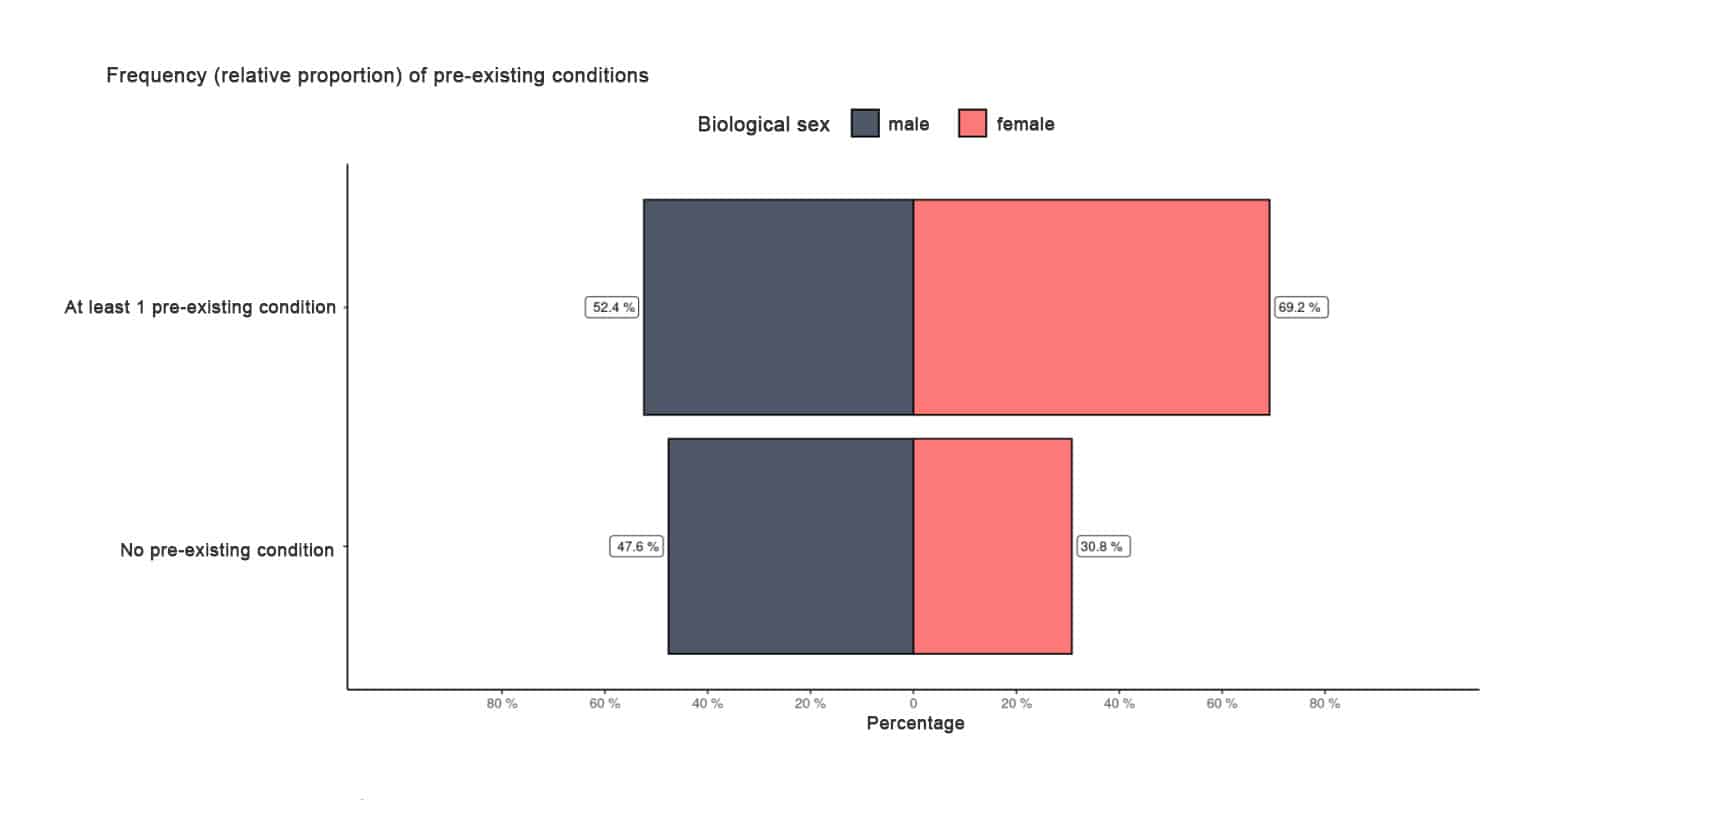
3.1. Pre-existing conditions among respondents
Example: 52.4% of the men reported at least one previous illness. Among the women, this was 69.2%. Please note the information in section 3!
3.2. Type of previous illness
Interpretation example: Of the men surveyed, 10% stated that they suffered from high blood pressure (multiple answers were possible).
4. Side Effects After 1st Vaccination
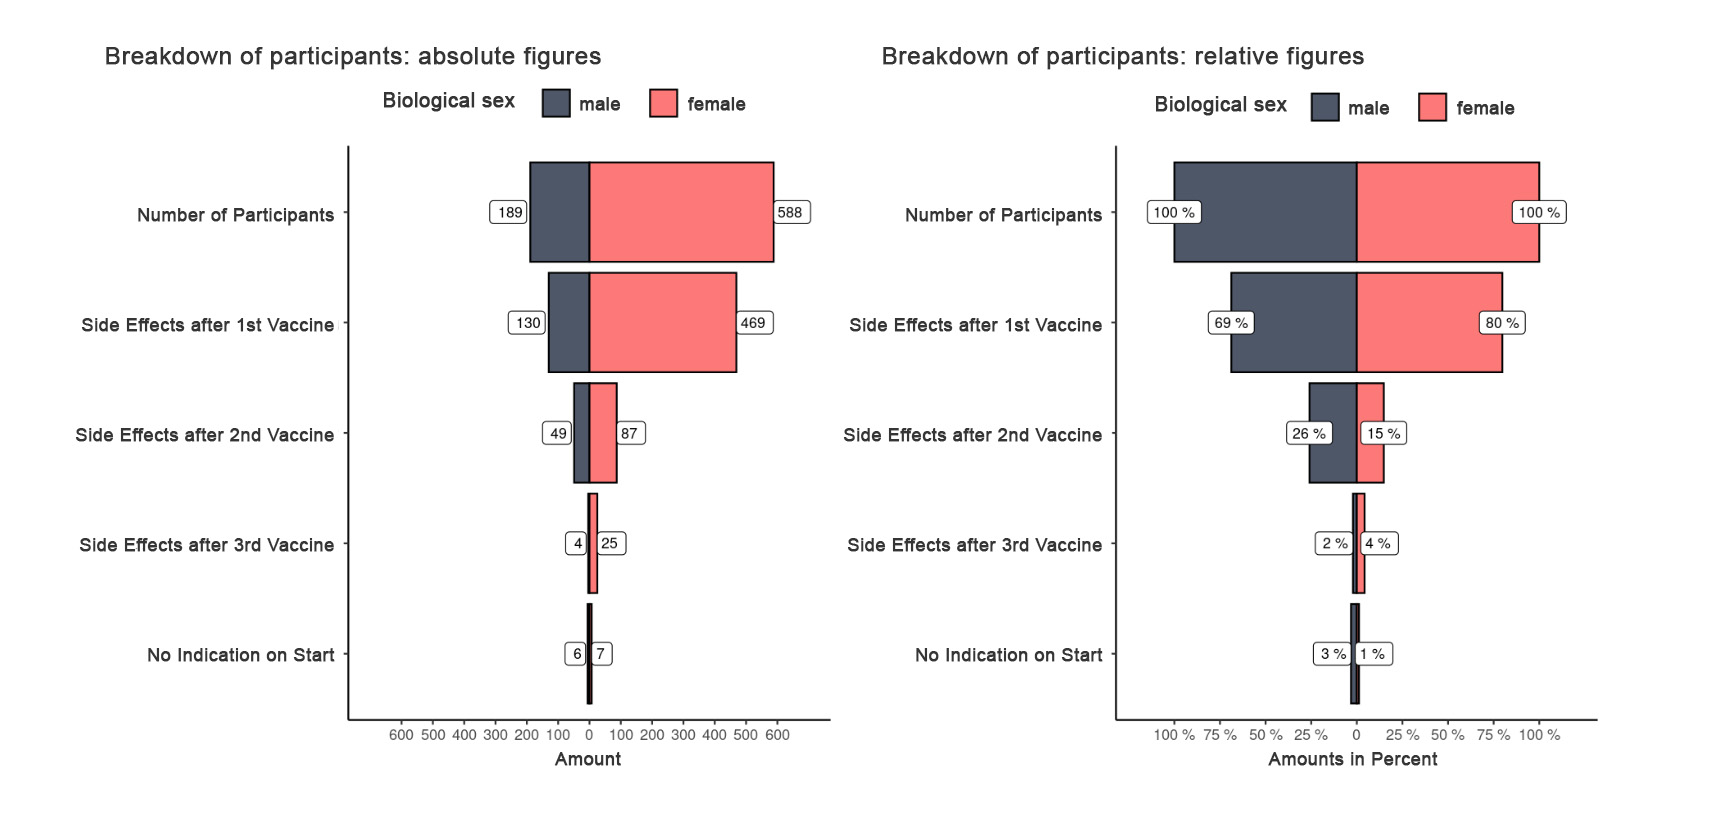
The relative numbers presented in the following sections (4.x) are for the 130 individuals (69% of male survey respondents) and 469 (80% of female survey respondents), who reported that adverse events began after administration of the first vaccination (n = 599)
Approximately 3/4 of the respondents developed PVS already after the 1st vaccination. For this reason, the following evaluation of symptoms is limited to this cohort only. Accordingly, 1/4 of the respondents developed the PVS after the 2nd or 3rd vaccination. A 4th vaccination was not asked about at the time of the survey. In the meantime, there are reports of affected persons in the forum who state that they developed the PVS only after the 4th vaccination.
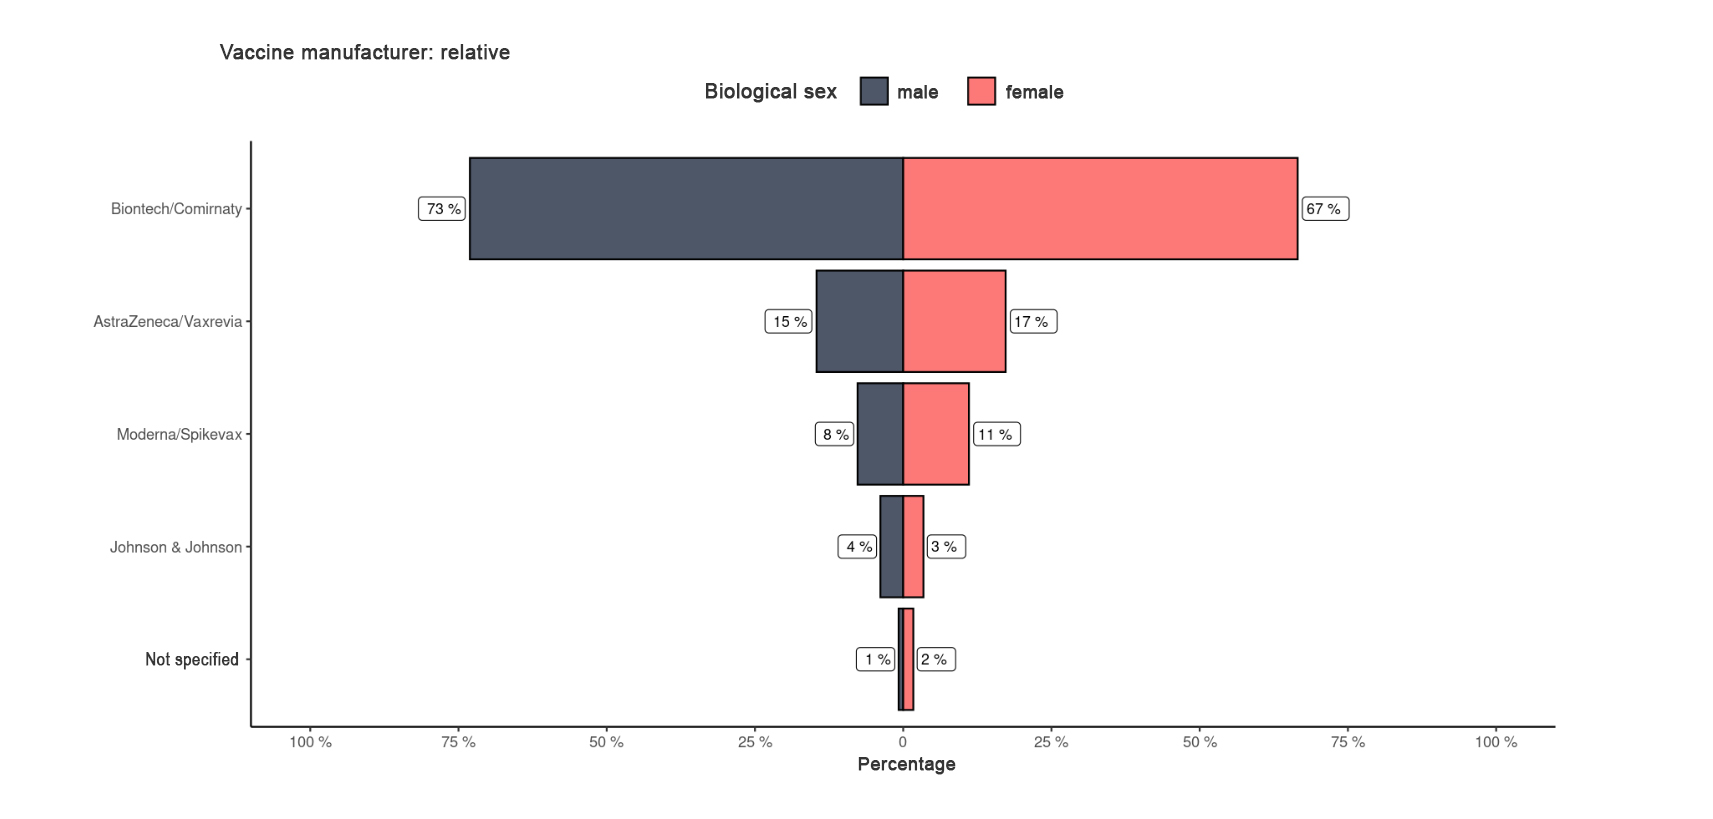
4.1. Vaccine Manufacturer
Without comparison to the values of a representative control group, no conclusions can be drawn about the qualitative properties with regard to the side effects of the individual vaccines.At the time of the survey design, the Novavax vaccine was not yet in use and was therefore not considered. However, there are individual reports in the forum where affected people mention corresponding complaints after vaccination with Novavax.
Interpretation example: 73% of men surveyed received the Comirnaty vaccine.
4.1.1. Onset of long-term side effects after 1st vaccination.
Interpretation example: 57.4% of respondents reported that their long-term side effects started within 1st week after the 1st vaccination.
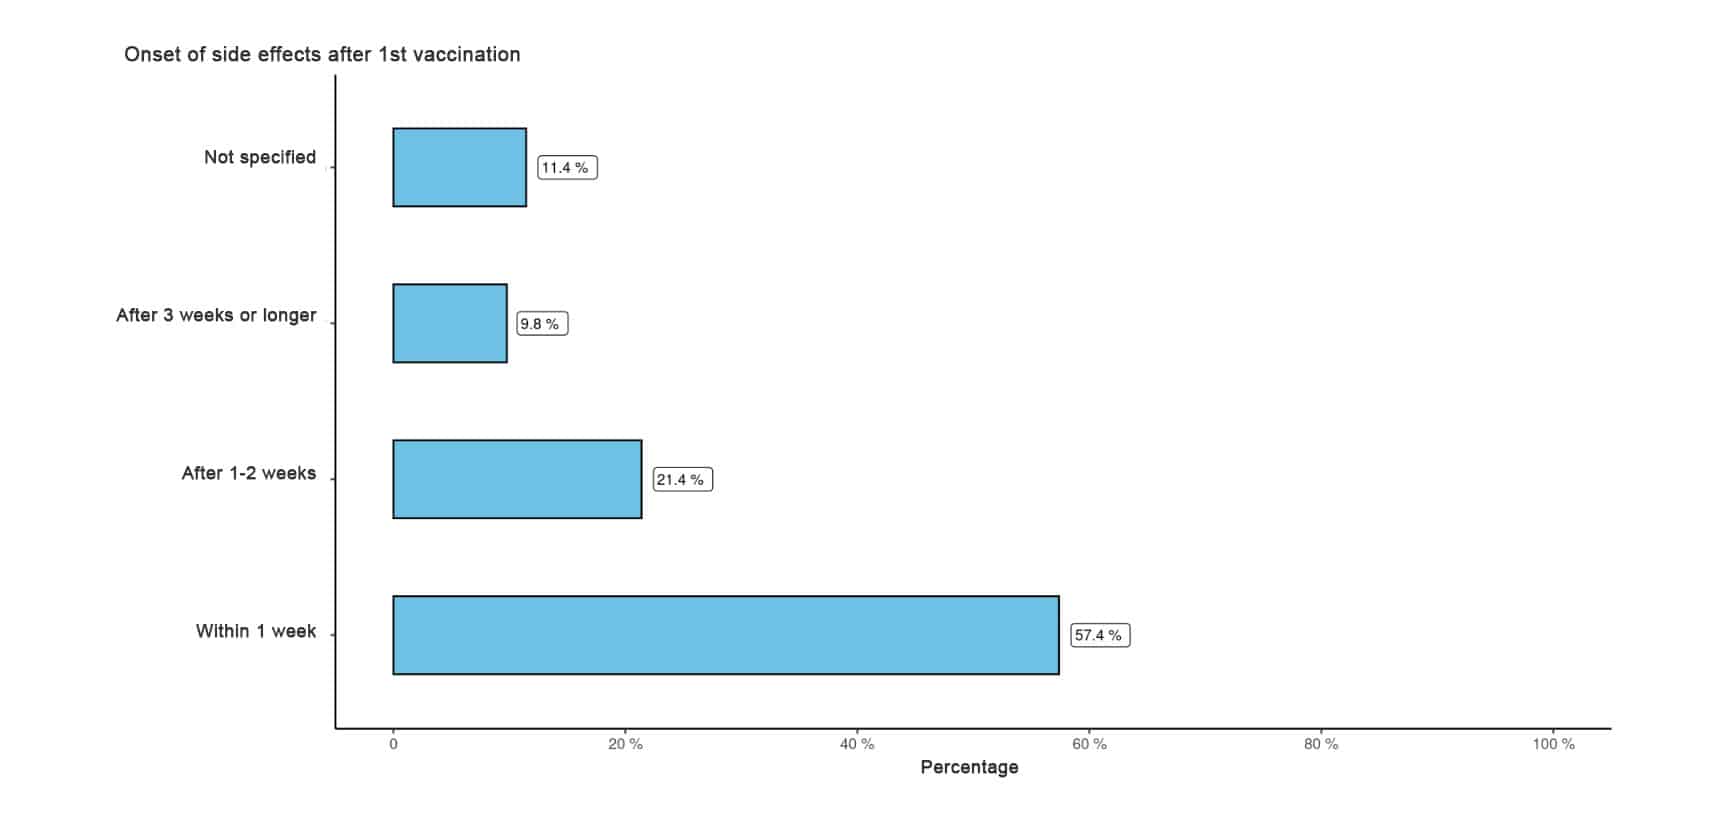
The short interval between vaccination date and onset of long-lasting symptoms increases the likelihood of a direct casual relationship. For more information, see limitations under 1.
4.2. Summary: Symptoms and symptom groups
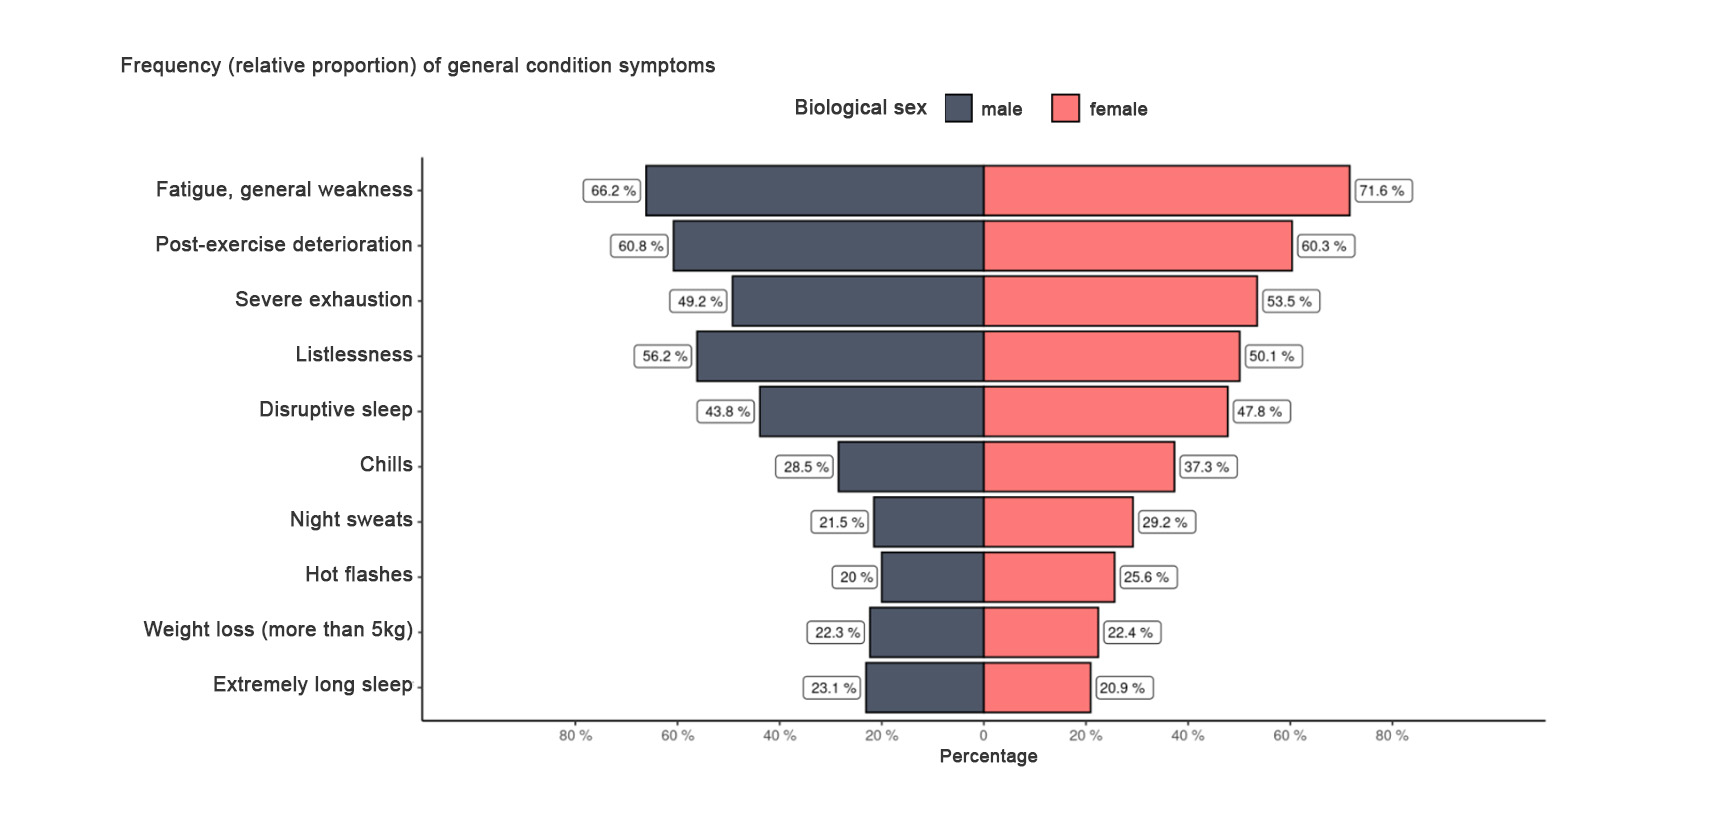
Note: The symptoms queried in the respective symptom groups can be found in the detailed evaluation under 4.3. For technical reasons, the symptom group "General condition" could not be included in 4.2.
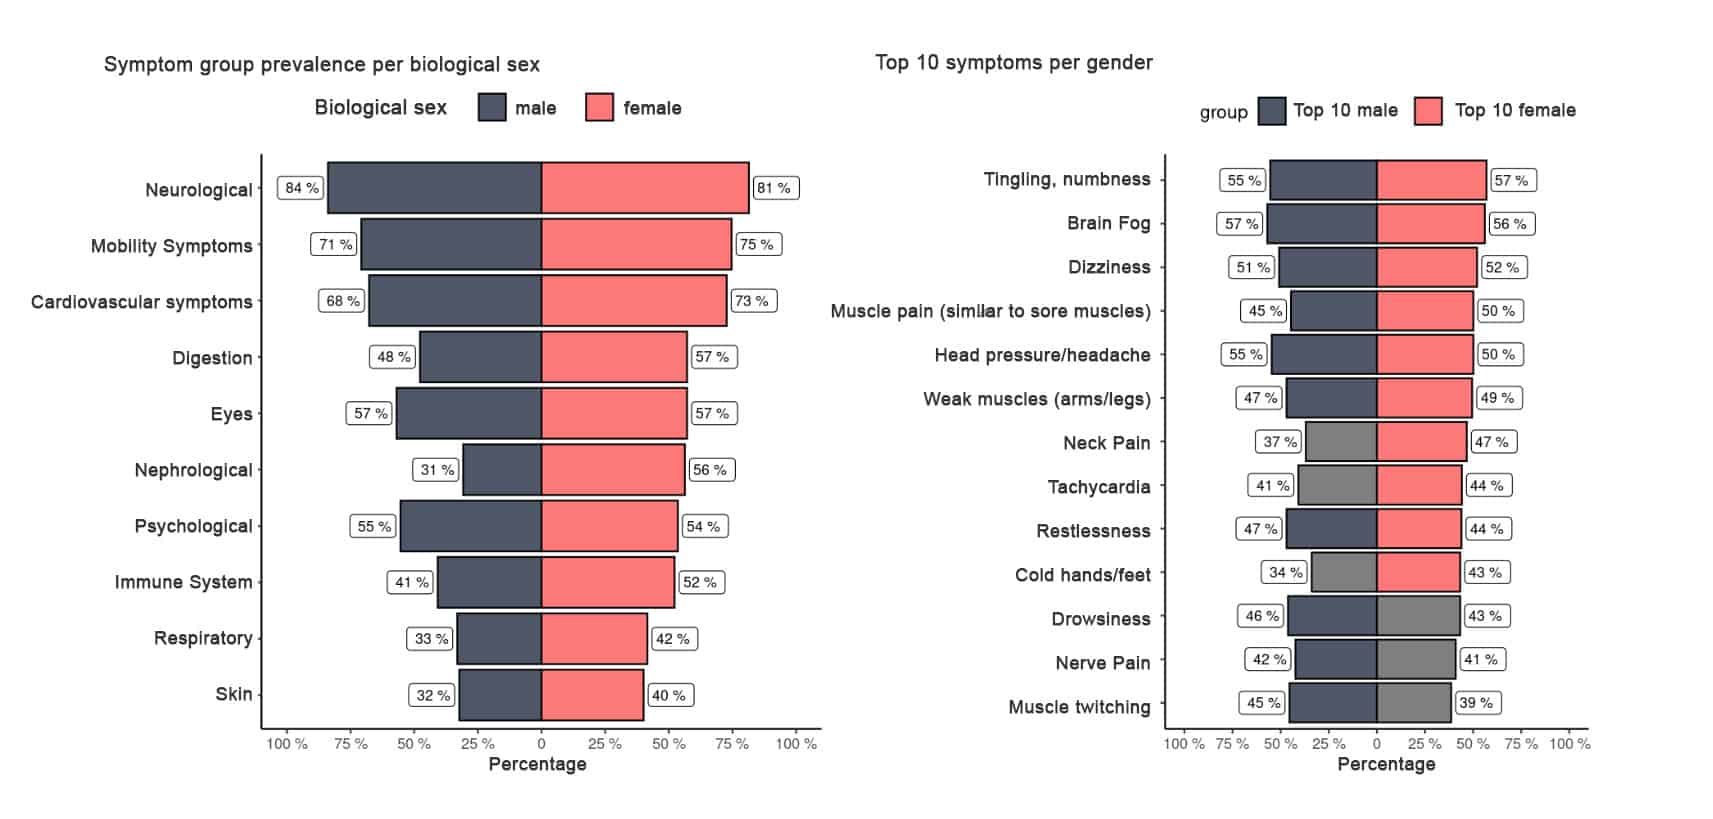
Interpretation example: 84% of the men reported at least 1 symptom from the symptom group "Neurological".
Interpretation example: 57% of the female respondents reported the symptom "tingling, numbness", which was the most frequently mentioned symptom by female participants.
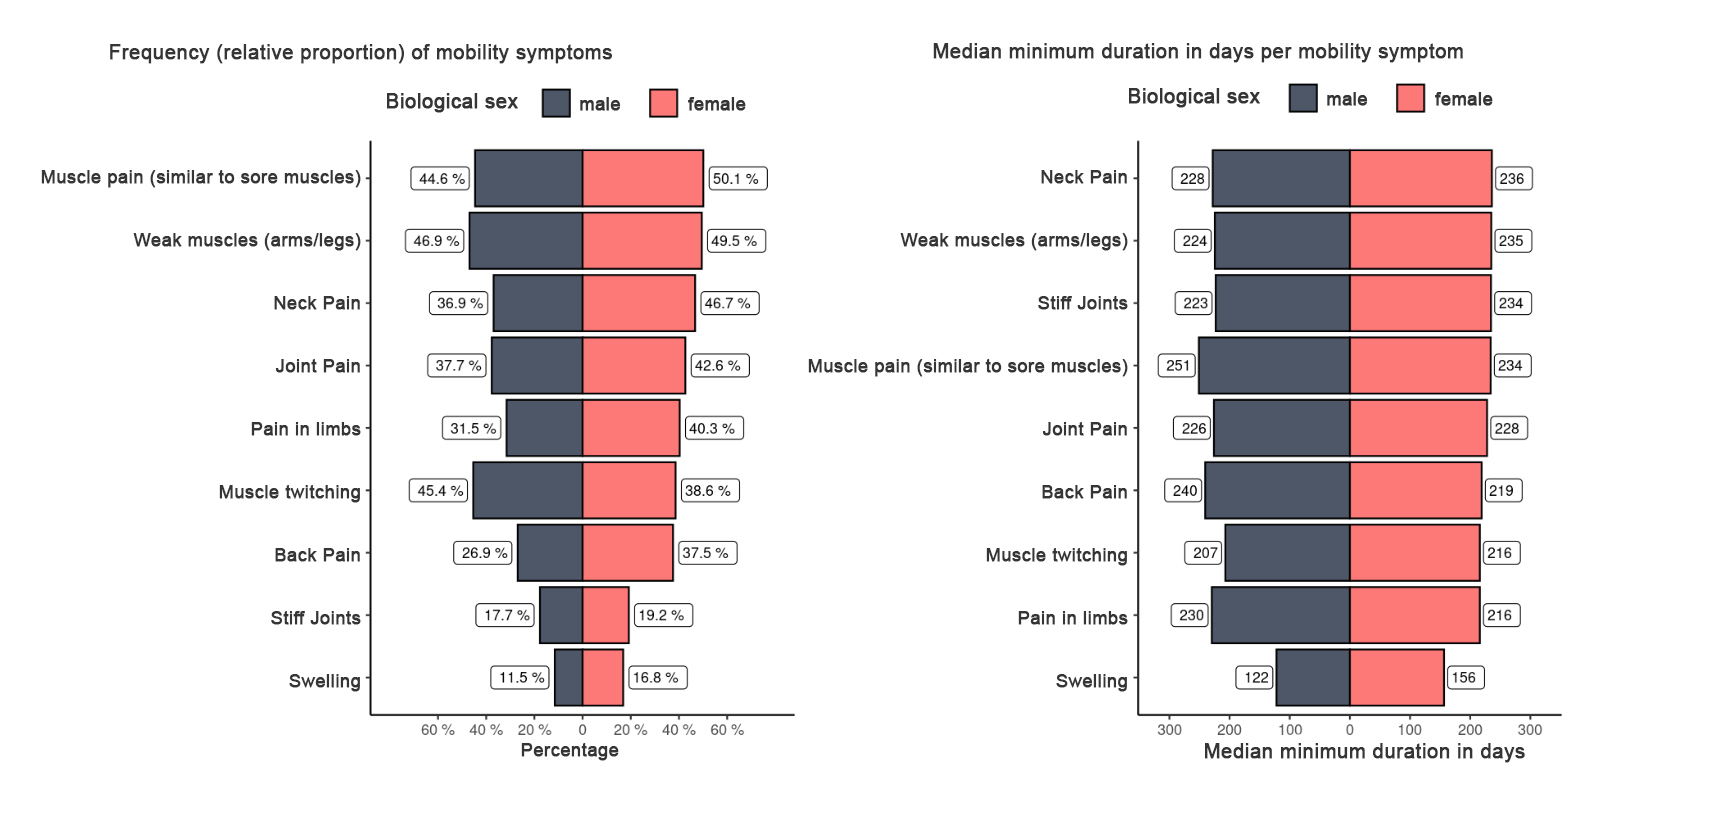
The symptom "neck pain" was among the 10 most frequently mentioned symptoms of women, but not among men.
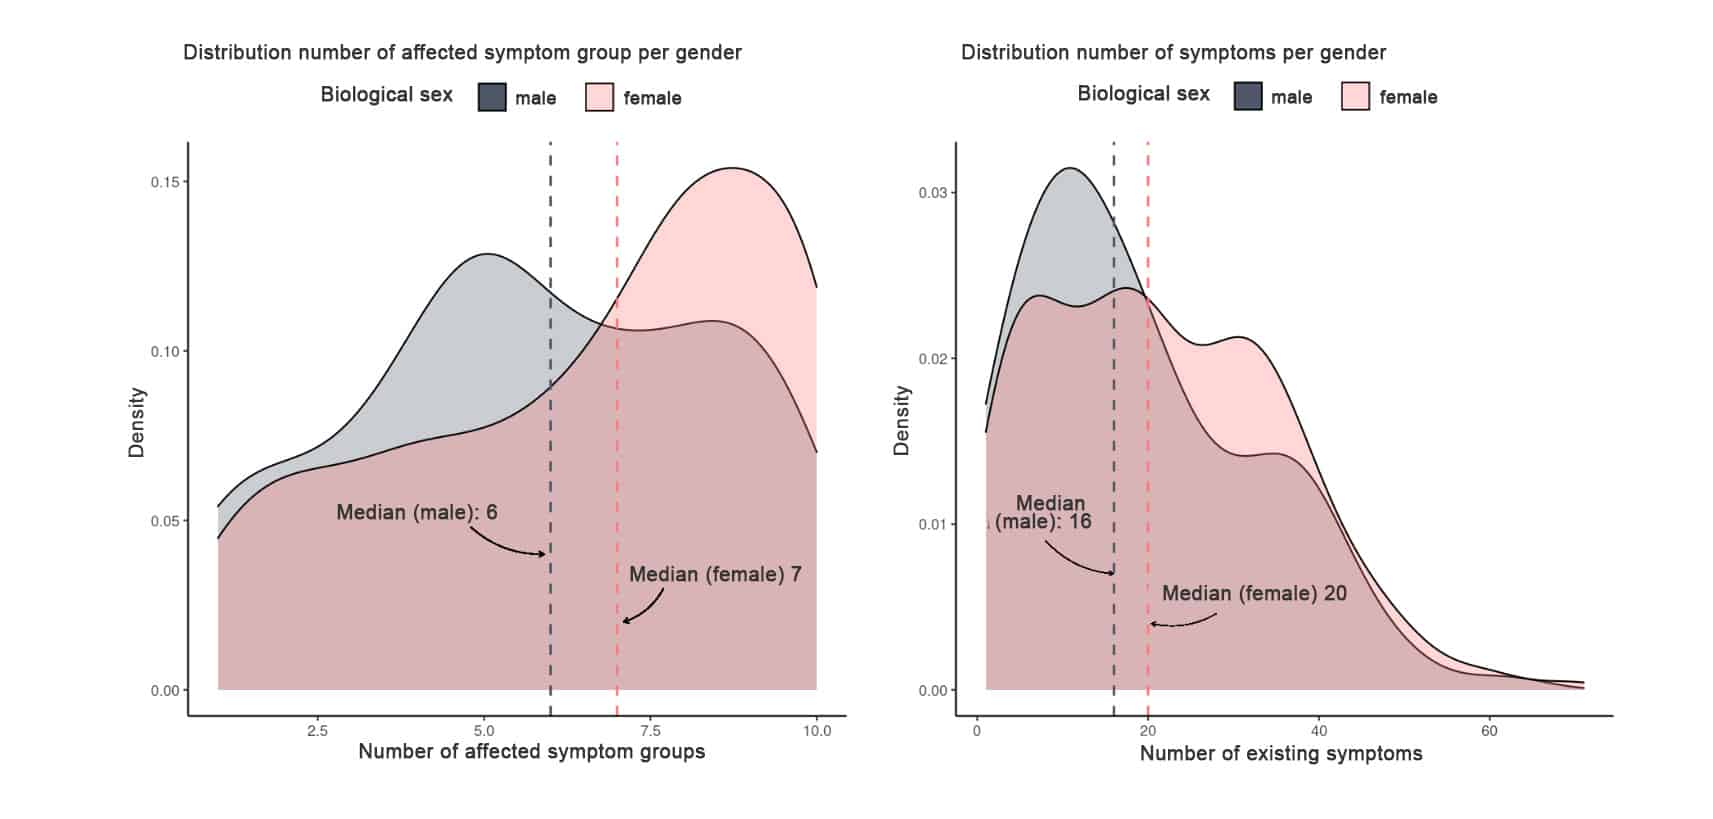
The two graphs above show the respective density over the number of affected symptom groups or symptoms.
The graphs read as follows: 50% of men(women) reported at least 1 symptom in more than 6(7) symptom groups. 50% of men reported more than 16 (20) different symptoms across all symptom groups.
This illustrates how broad the symptoms of post-vac syndrome are and how many different systems of the body can be affected. PVS can therefore be described as an extremely multifaceted and complex condition.
4.3. Symptom groups in detail
4.3.1. Neurological symptoms
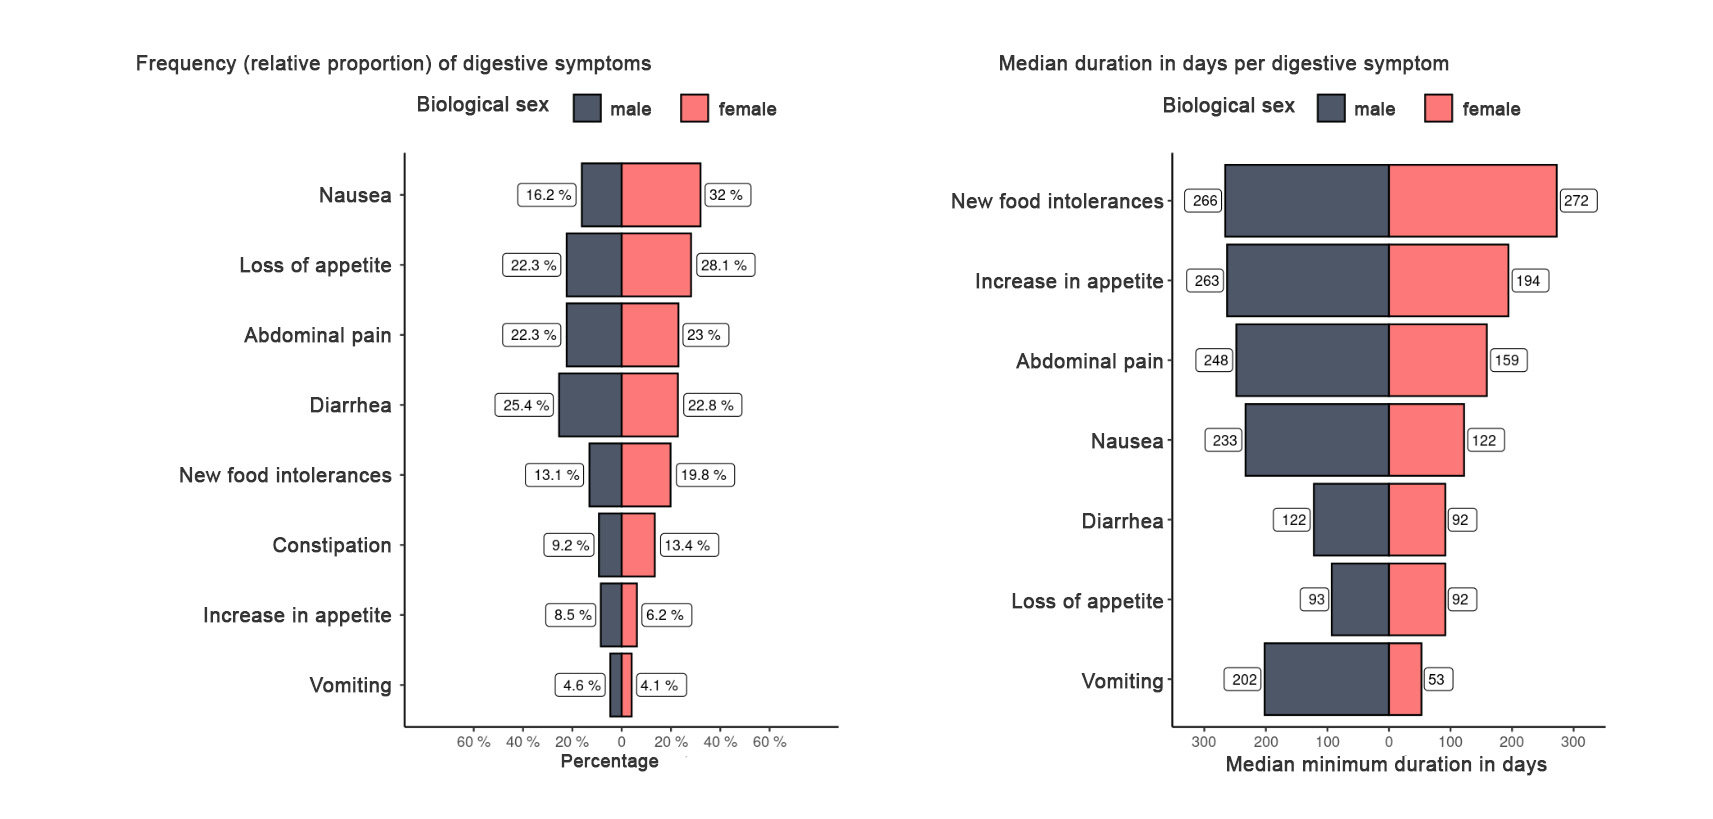
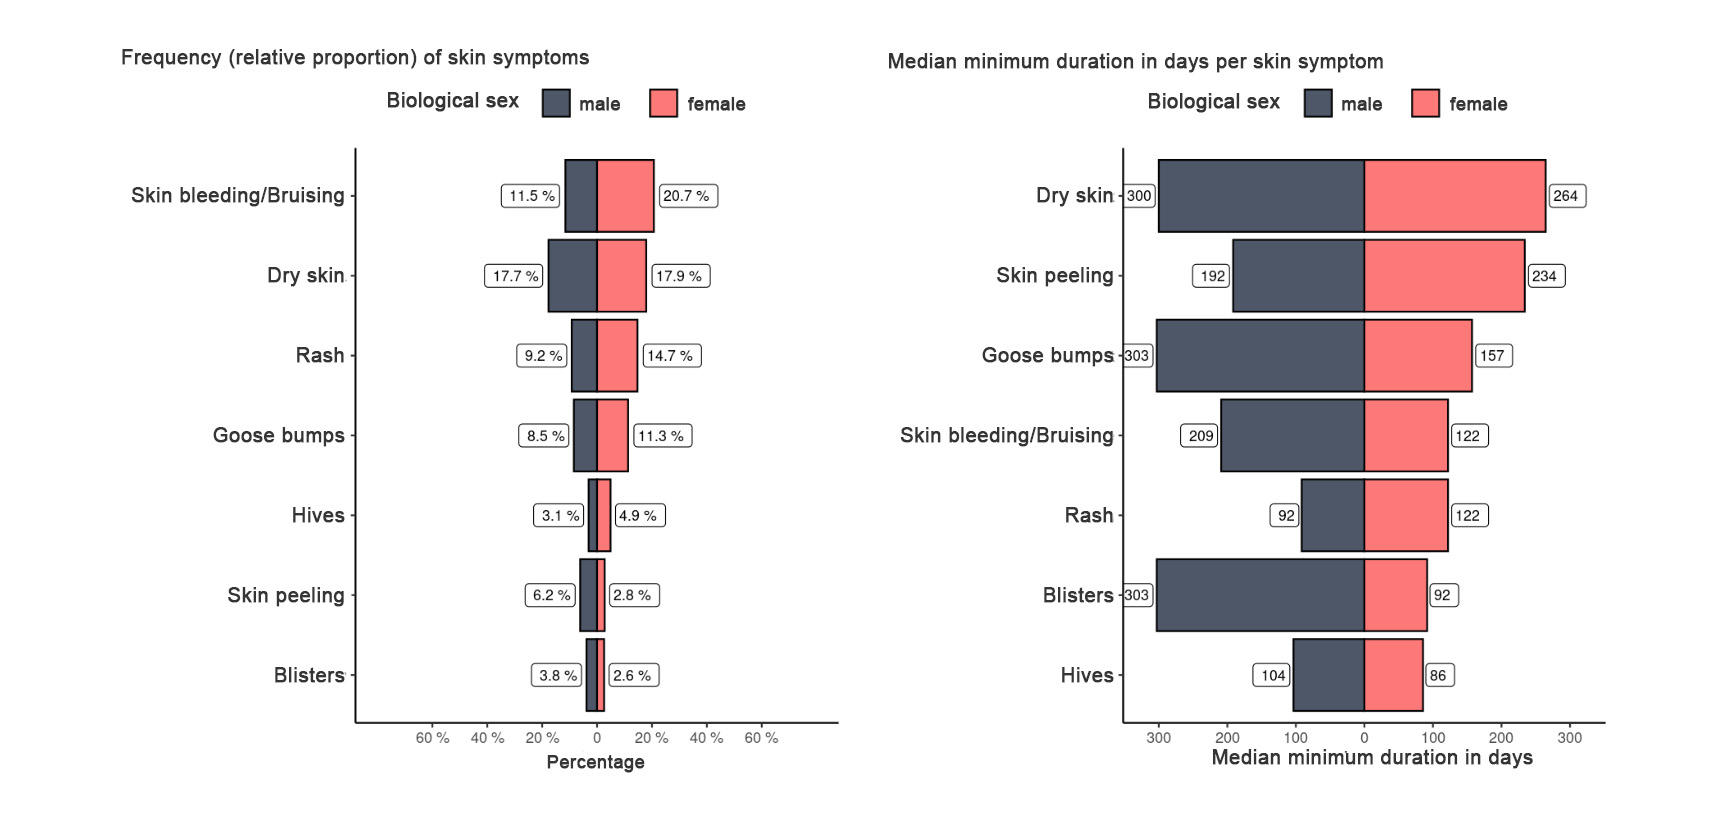
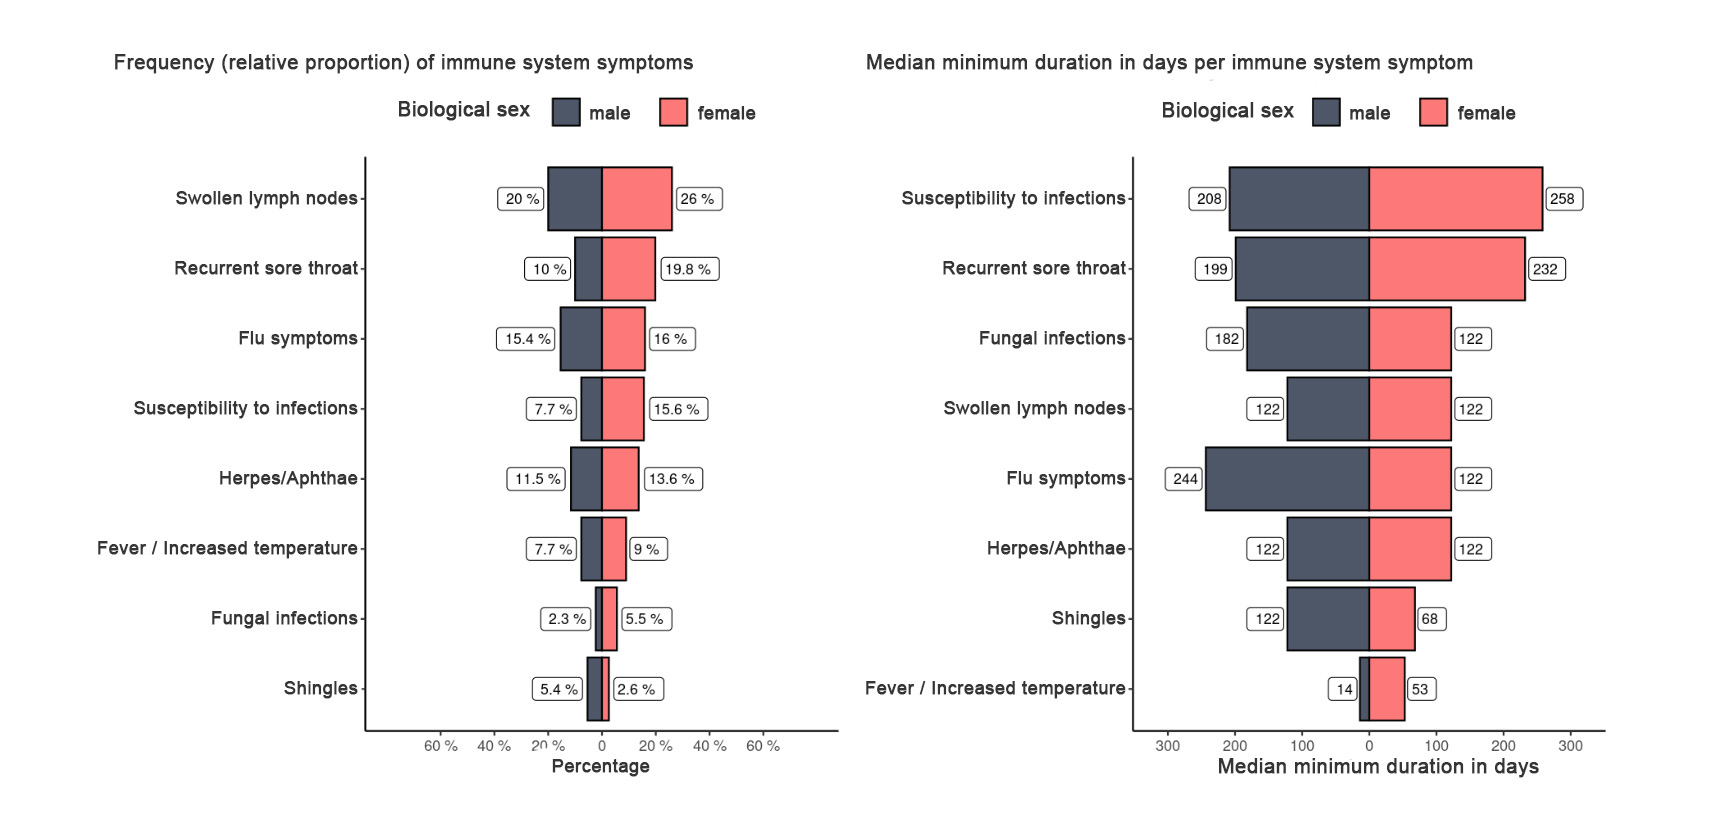
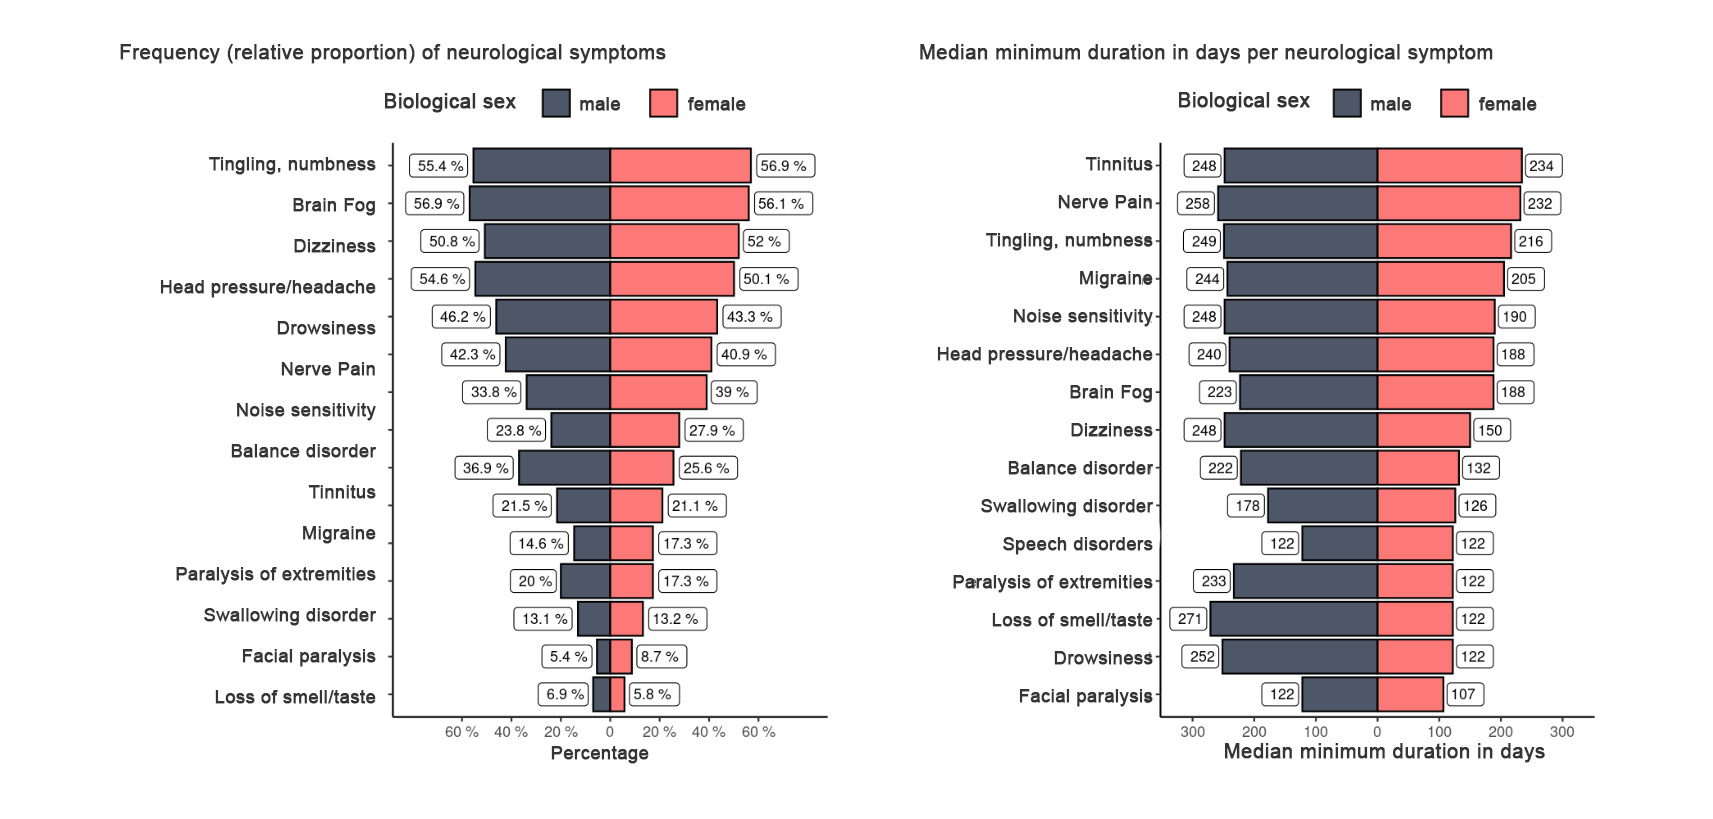 Note on the evaluation of the median minimum duration of symptoms:
This is the median of the respective duration in days. If the response option "until today" was selected, the Indication relates to the date of the survey. The duration is then calculated from the respective vaccination date and the response date. This can thus be both overestimated (side effects do not occur immediately after vaccination) and underestimated (side effects continue even after answering the survey).
This, of course, applies to all symptom groups.
Note on the evaluation of the median minimum duration of symptoms:
This is the median of the respective duration in days. If the response option "until today" was selected, the Indication relates to the date of the survey. The duration is then calculated from the respective vaccination date and the response date. This can thus be both overestimated (side effects do not occur immediately after vaccination) and underestimated (side effects continue even after answering the survey).
This, of course, applies to all symptom groups.
4.3.2. Mobility Symptoms
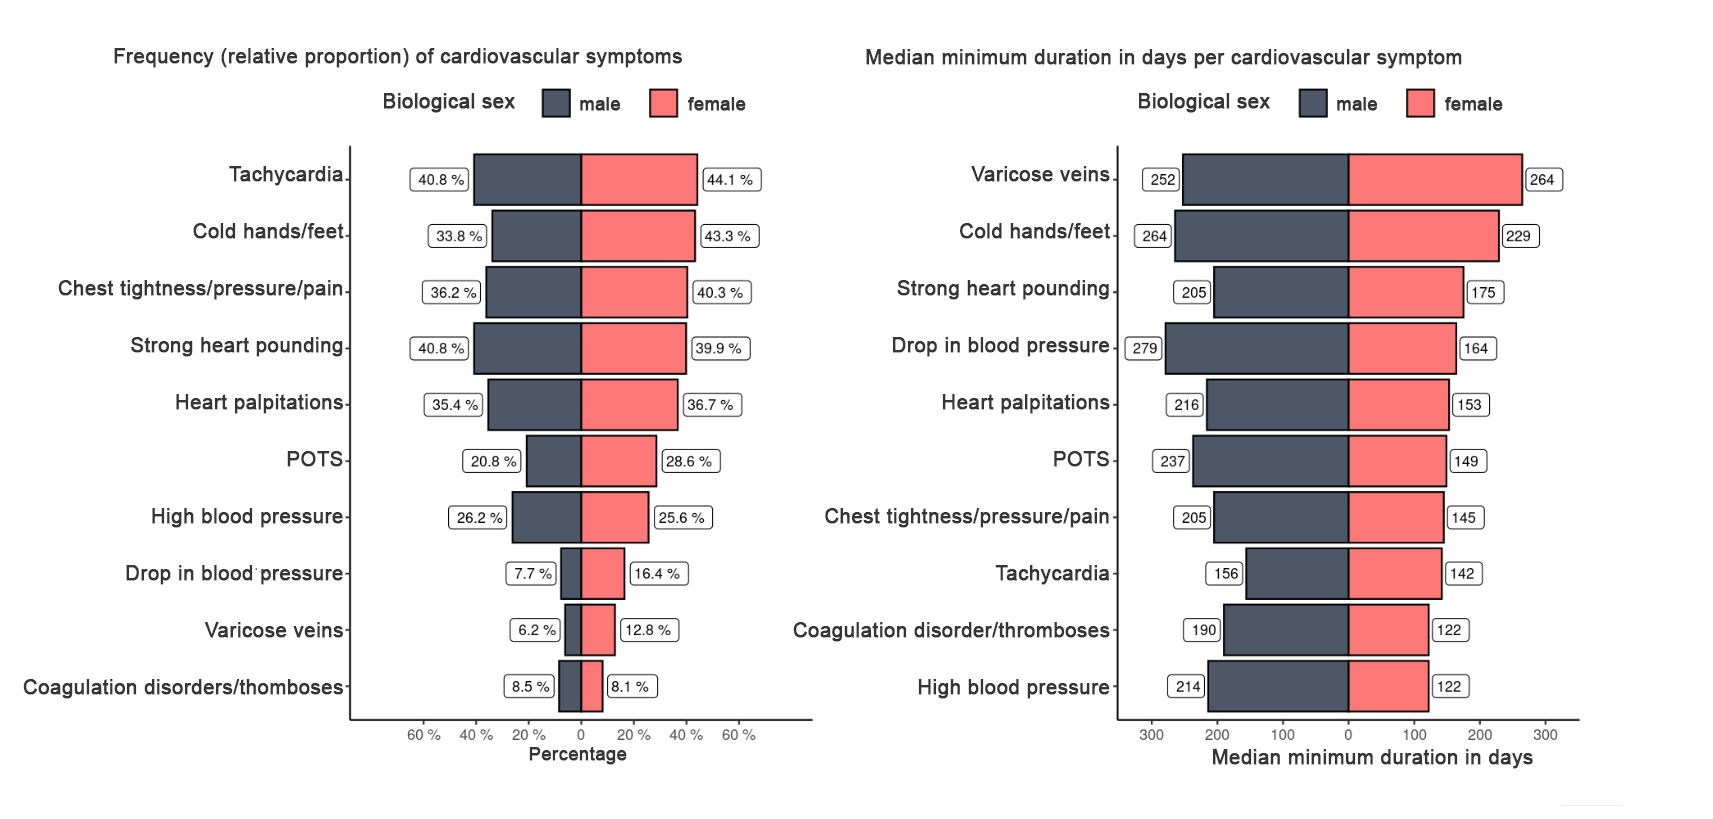
4.3.3. Cardiovascular symptoms
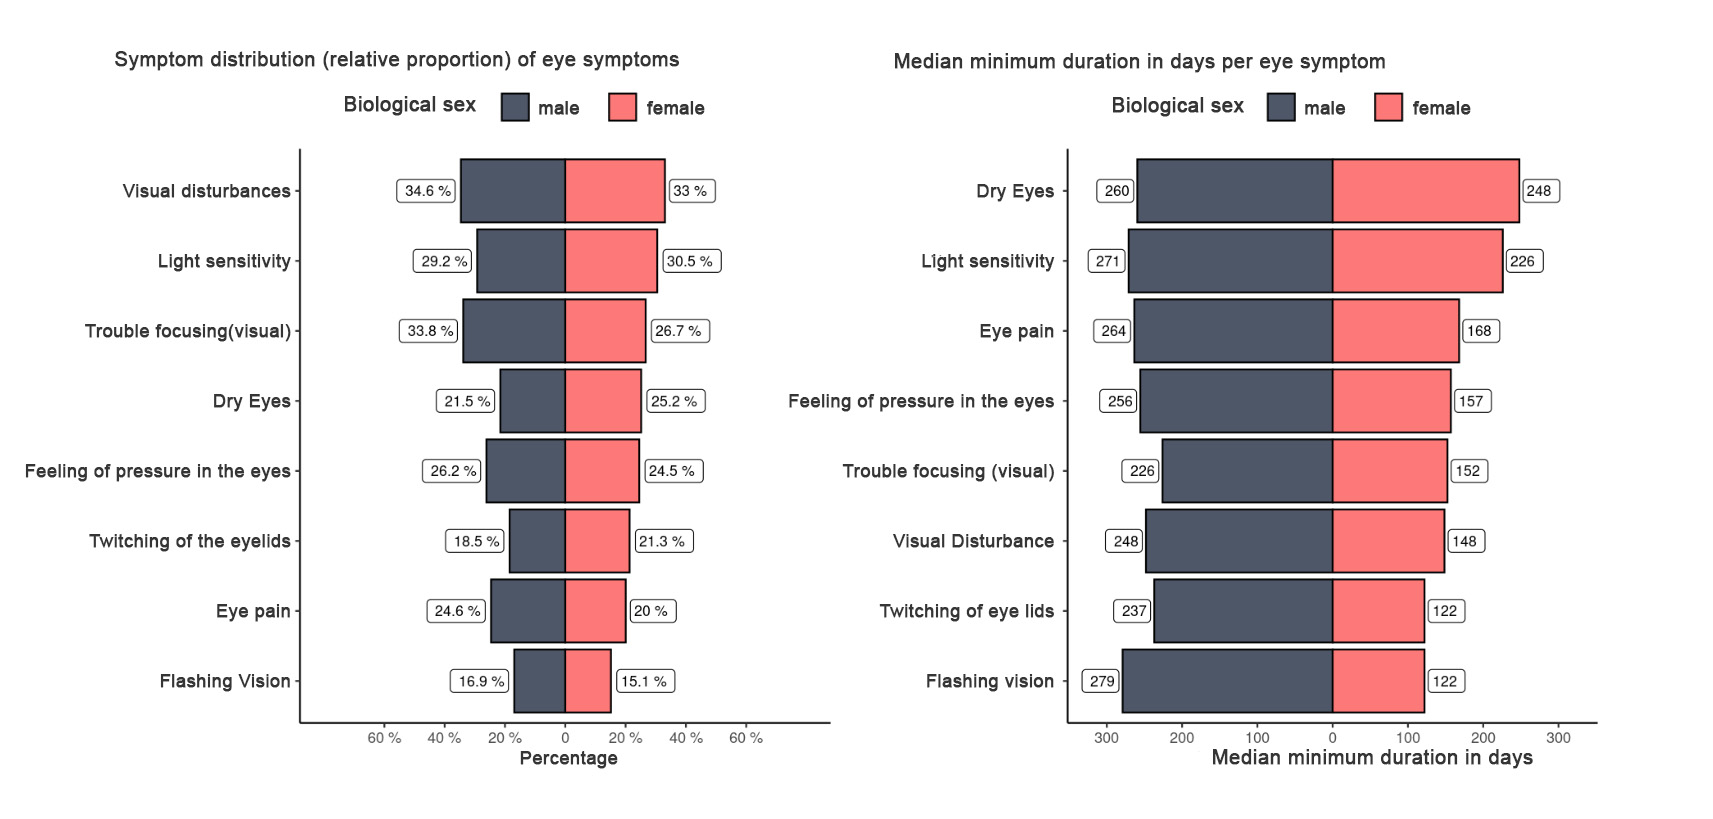
4.3.4. Eye symptoms
4.3.5. Digestion symptoms
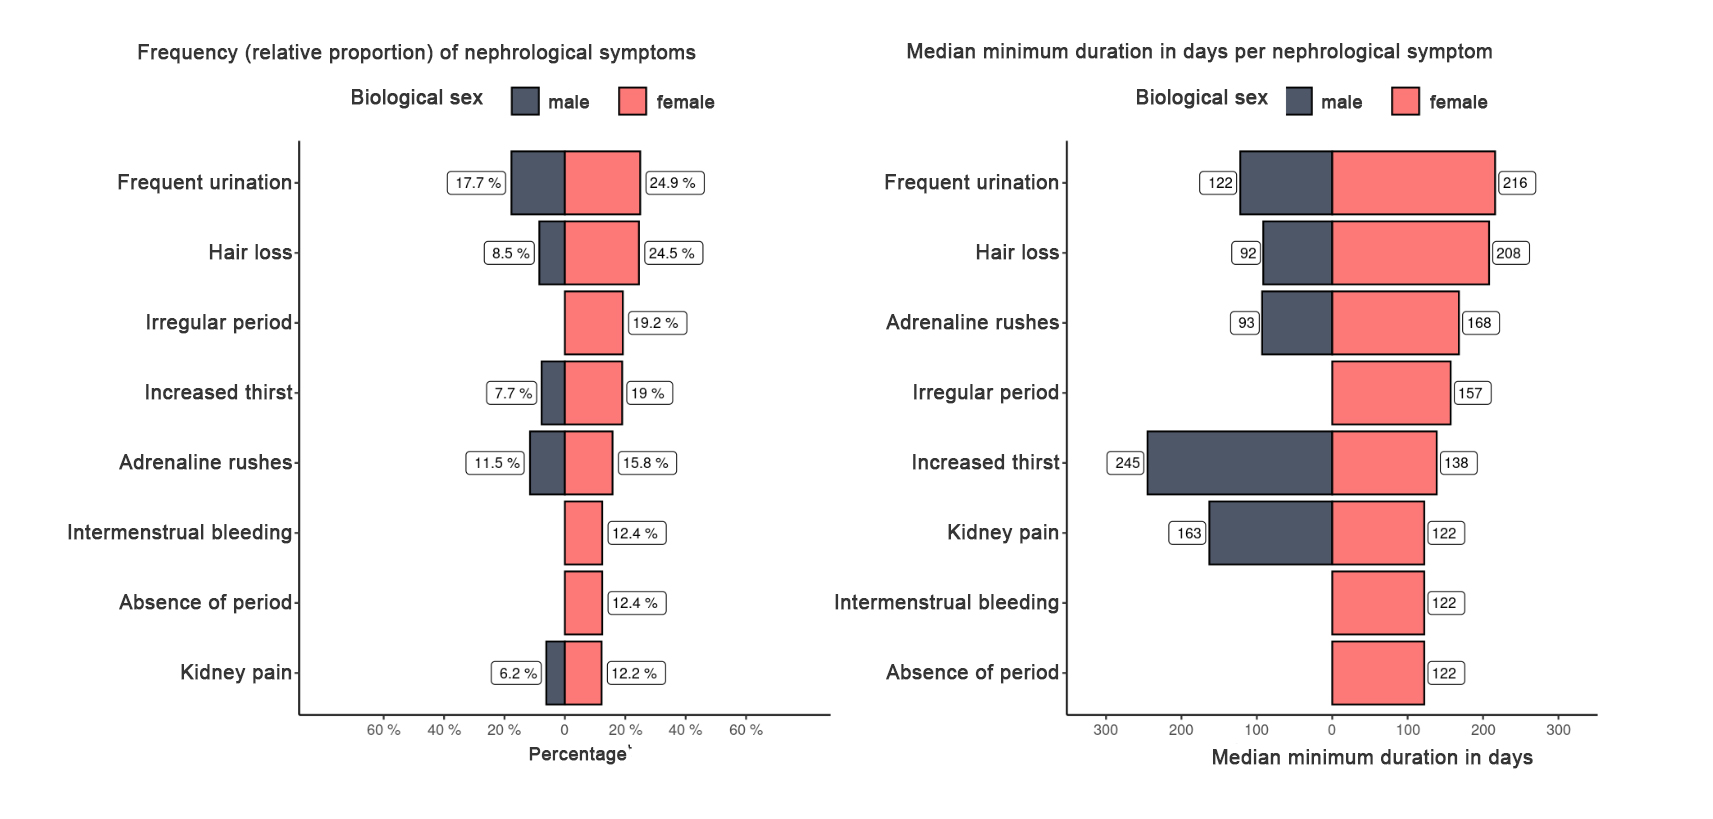
4.3.6. Nephrological symptoms
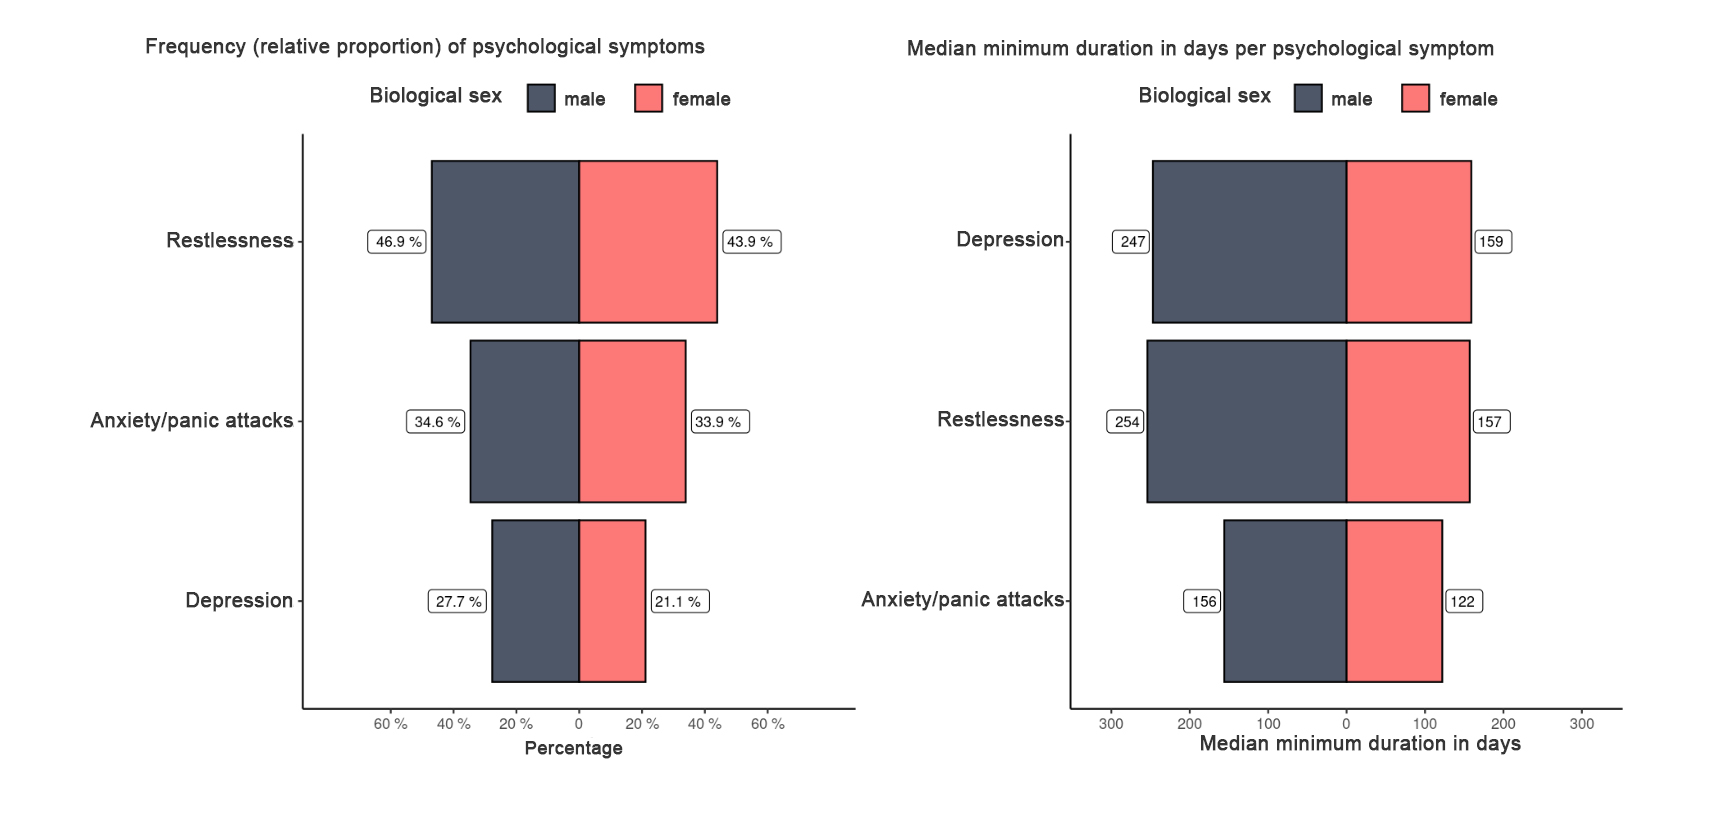
4.3.7. Psychological symptoms
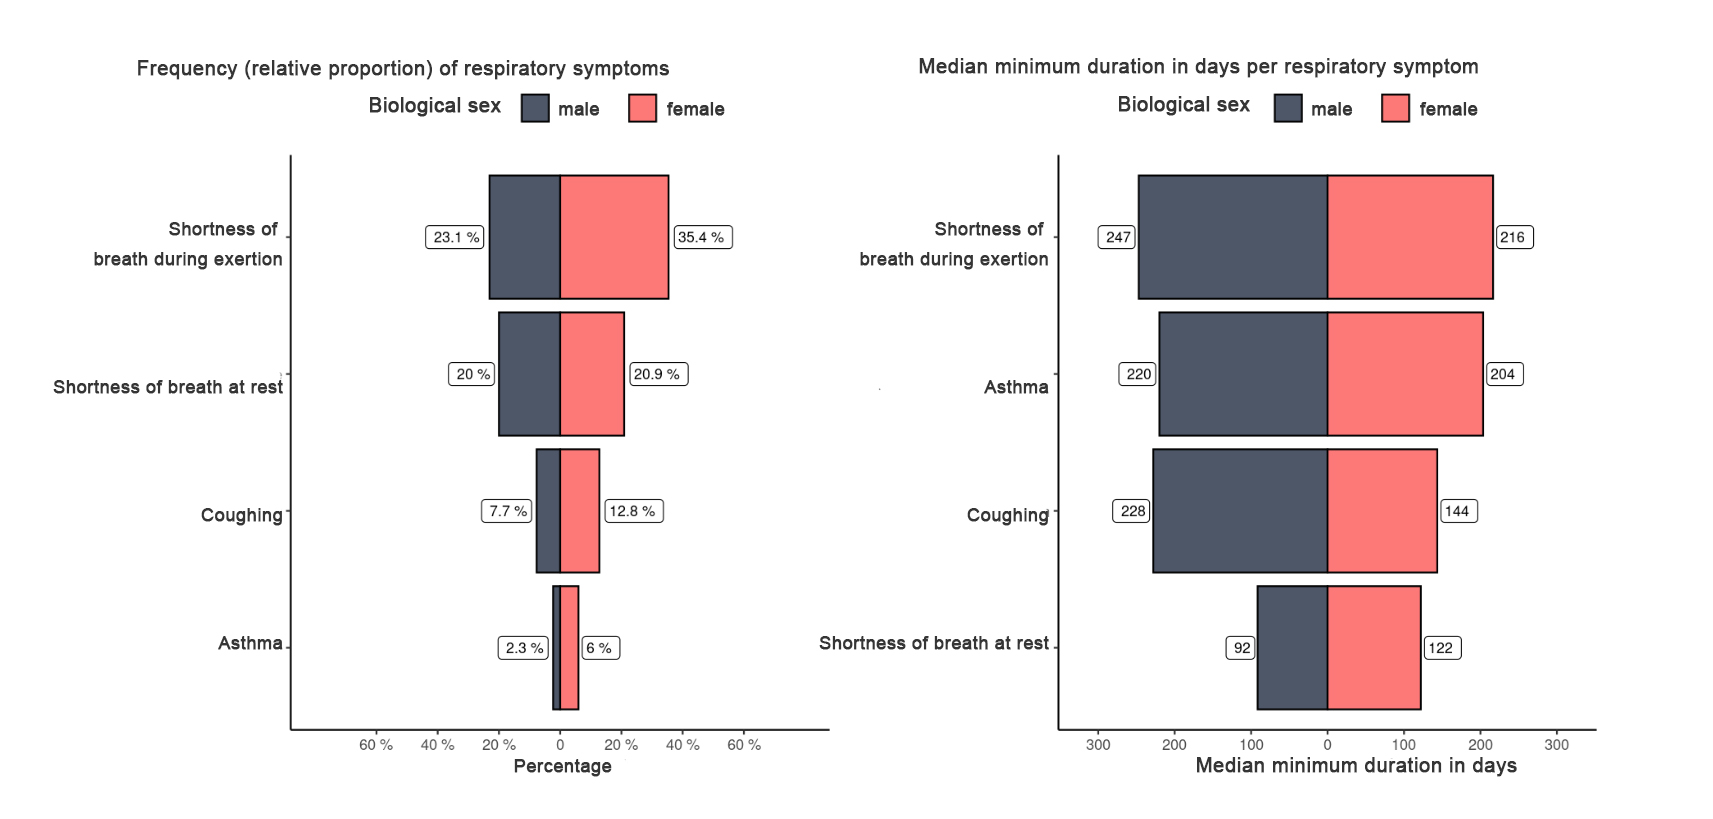
4.3.8. Respiratory symptoms
4.3.9. Skin symptoms
4.3.10. Immune system symptoms
4.3.11. General conditions
5. Final Questions
5.1. GPCR autoantibodies prevalence
Note: Due to an error in the question, only a partial cohort (n=296) could be included in the analysis of this question after correcting the question. Unfortunately, the n=481 responses collected before correction could not be included in this question. This circumstance results in different n for the subgraphs. For the first two graphs n = 296 (left) and 47 (right)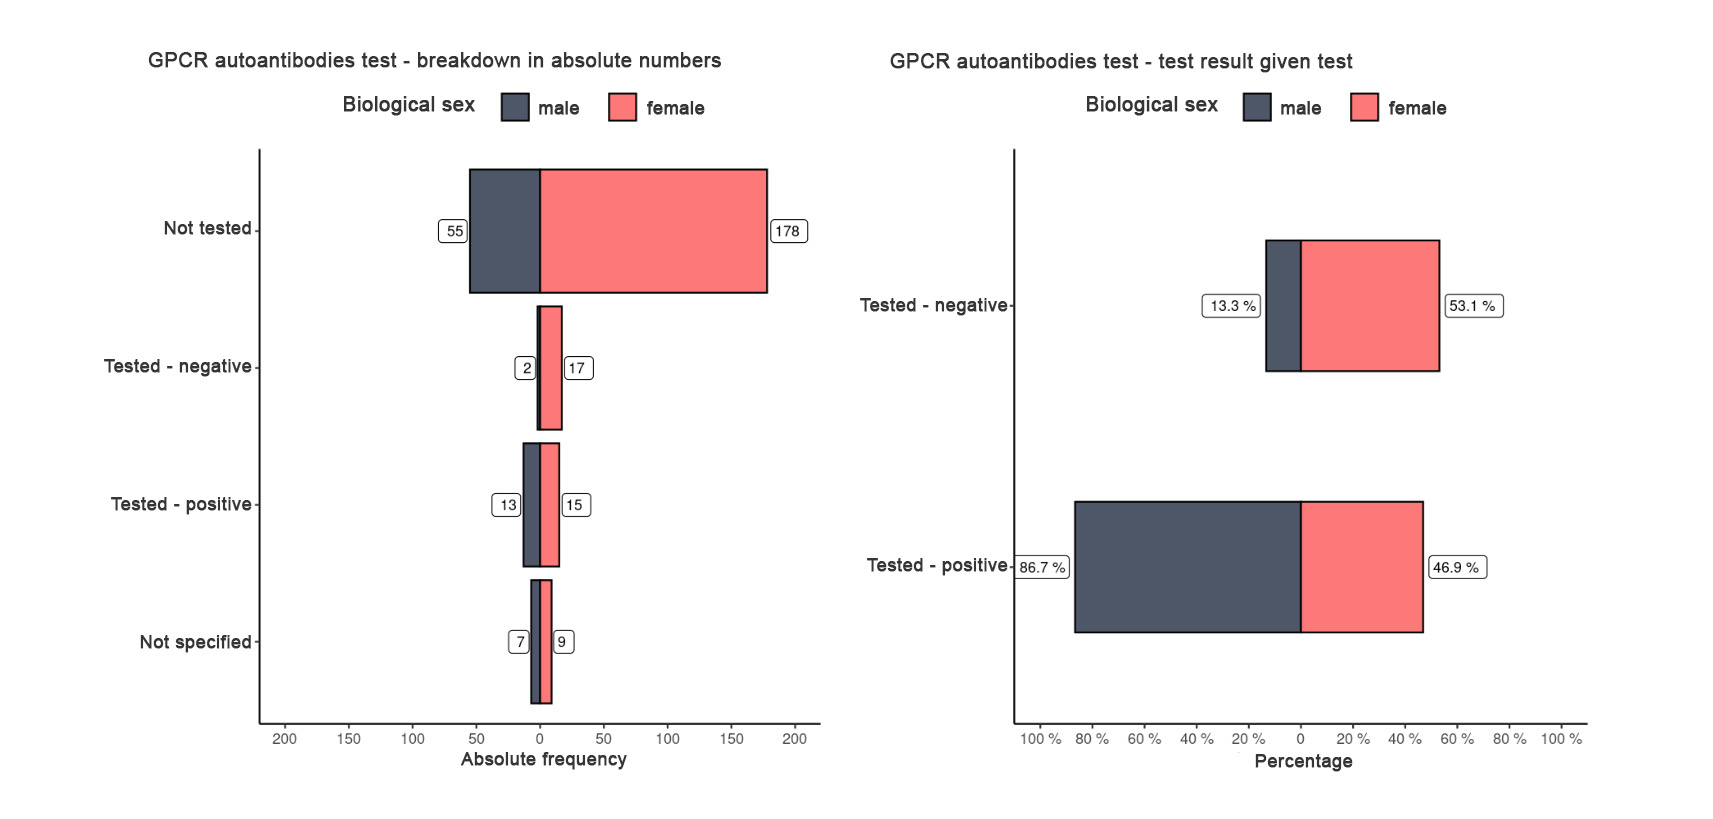
5.2. Reporting of side effects
n=777 Interpretation example: 67% of the respondents stated that their treating physician did not report the side effects to the appropriate authority. 75.6% indicated that they then carried out the reporting themselves.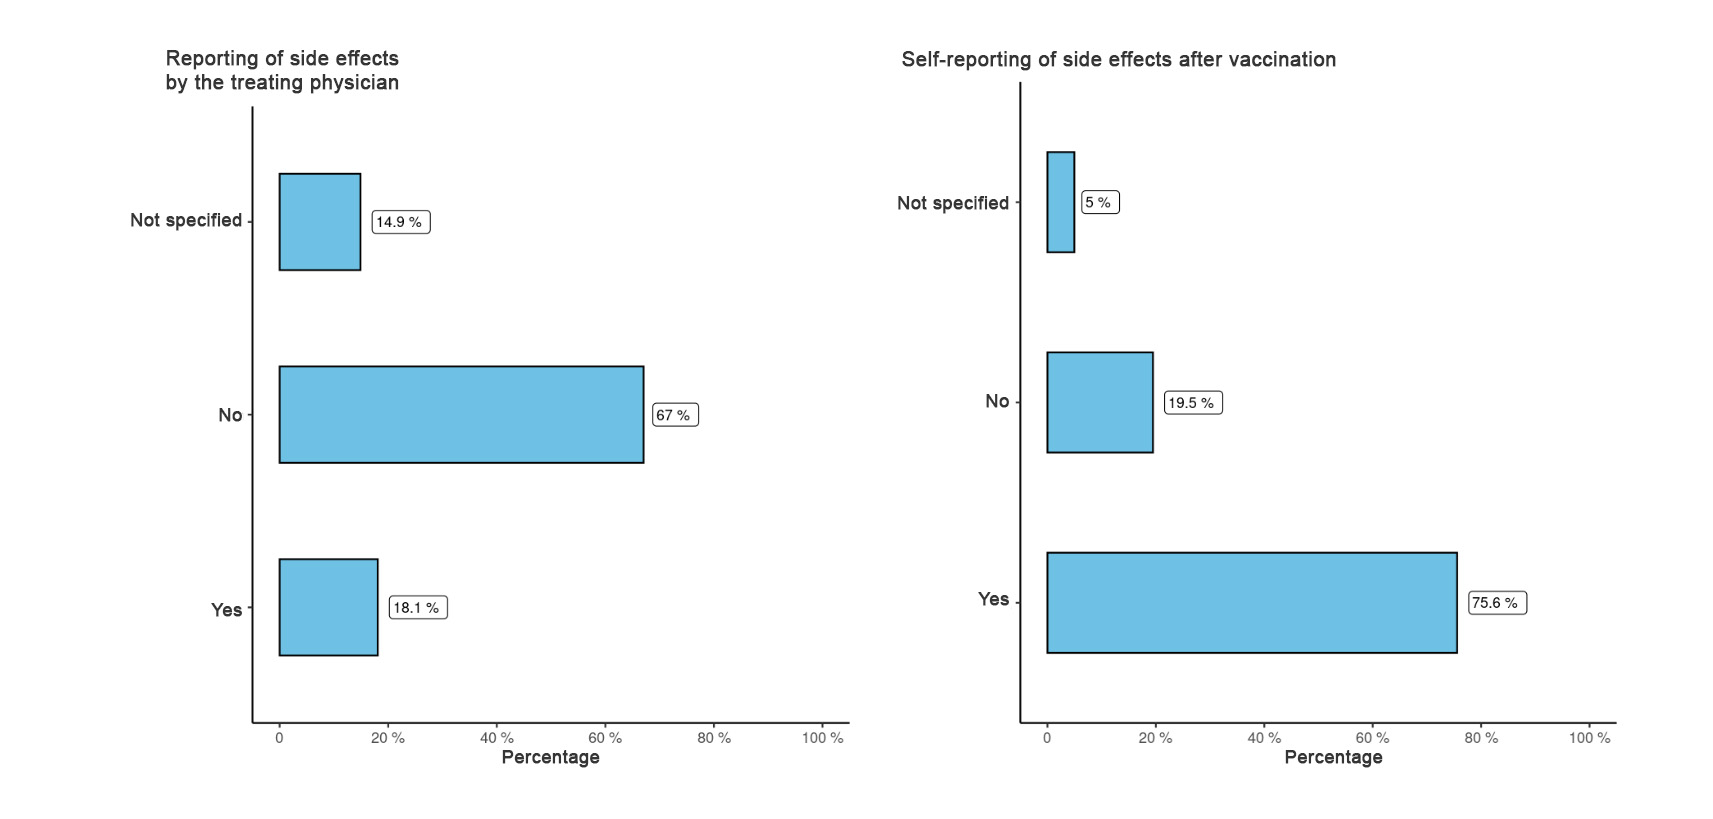
5.3. Emergency room stay
n=777 Interpretation example: 56% of women reported emergency department visits after vaccination.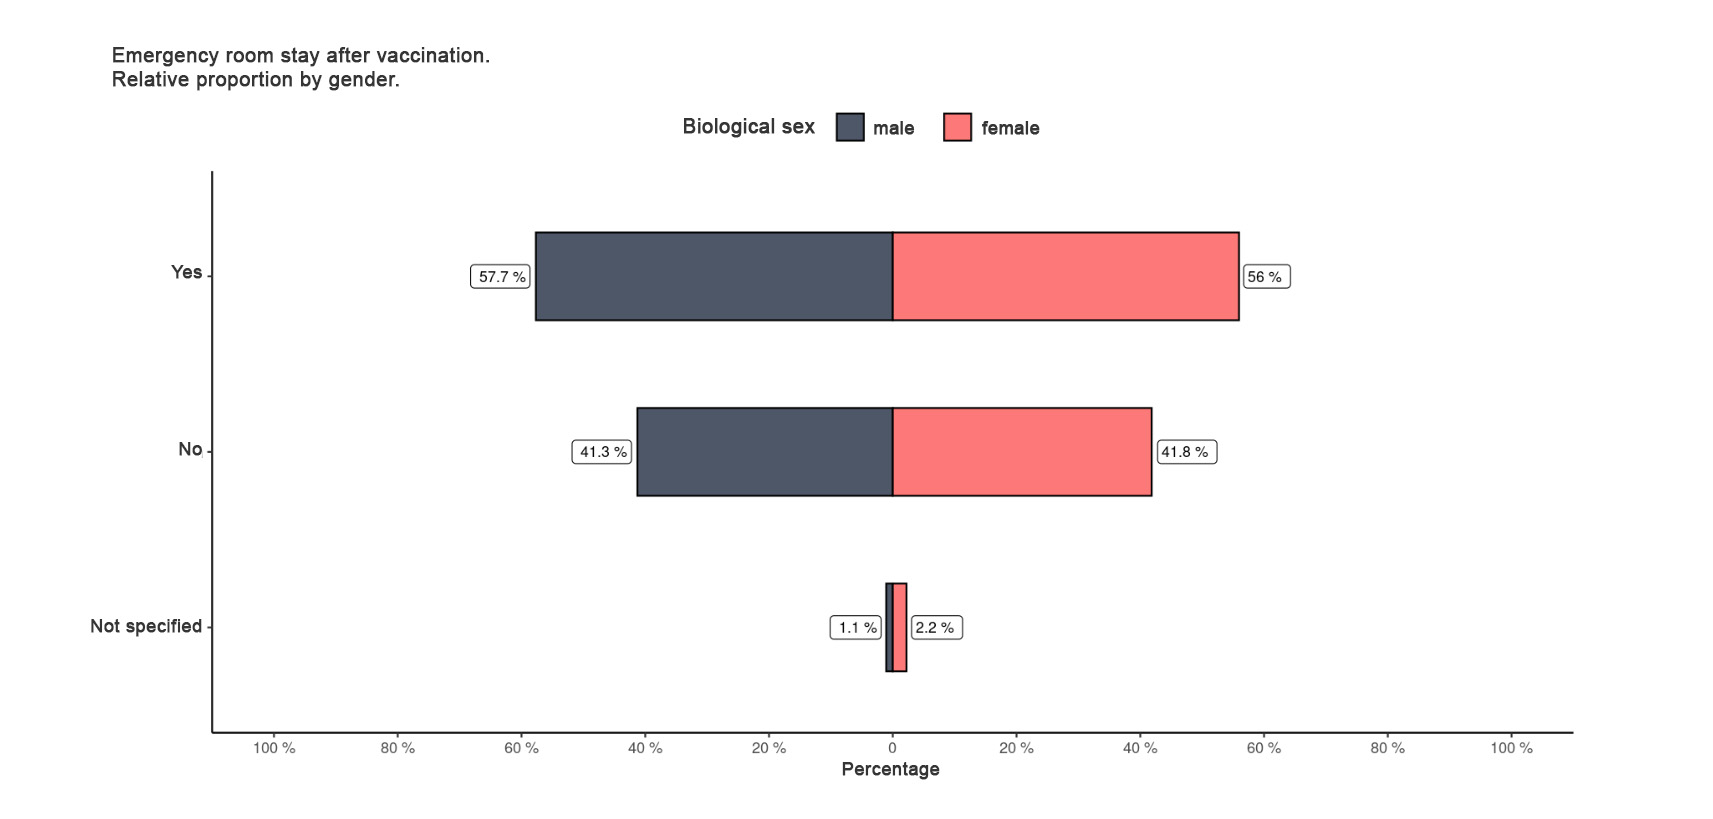
5.4. Activity level before 1st vaccination
n=599 Interpretation example: 12.4% of women reported that they were very physically active in their occupation, while 48.2% of women reported that they were more likely to have a sedentary/resting occupation.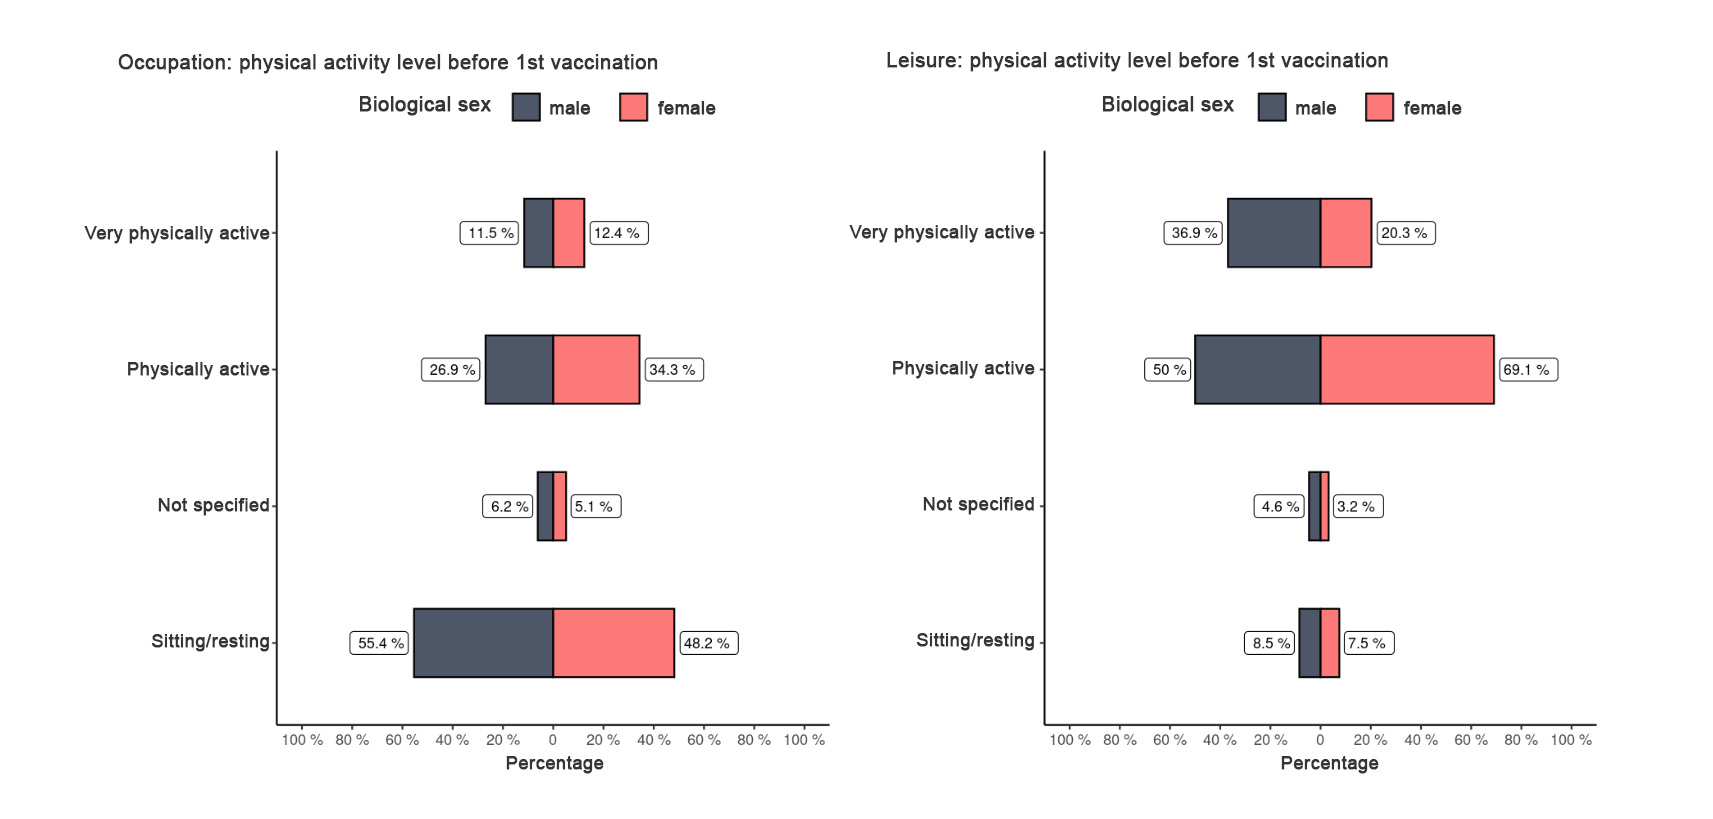
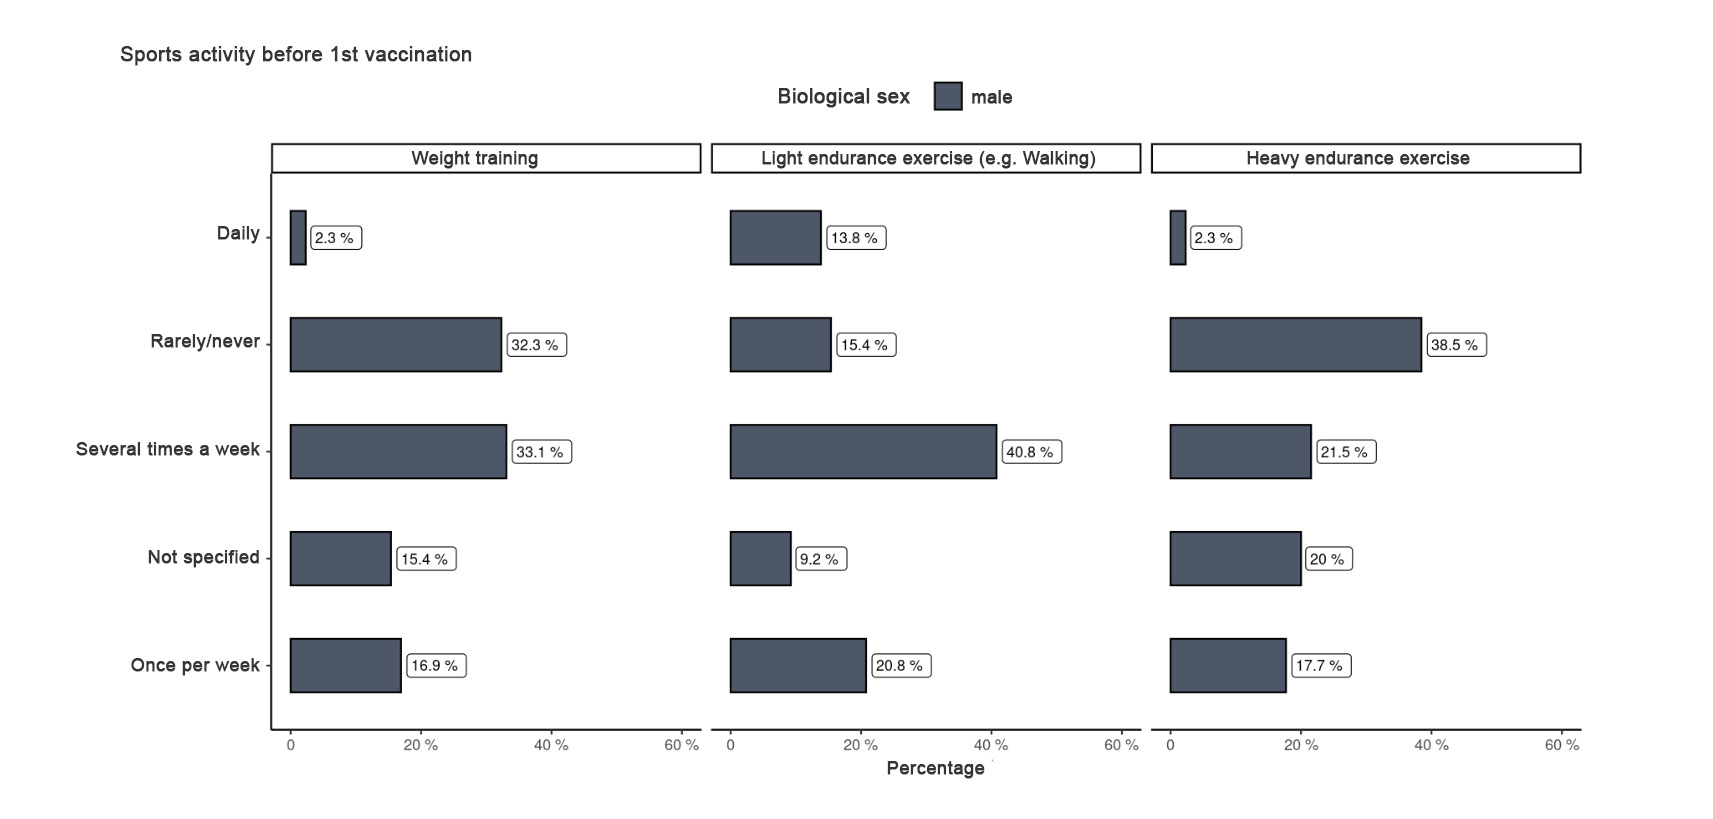
5.5. Physical activity level before vaccination
n=599 Interpretation example: 45.8% of women did light endurance sports several times a week before vaccination.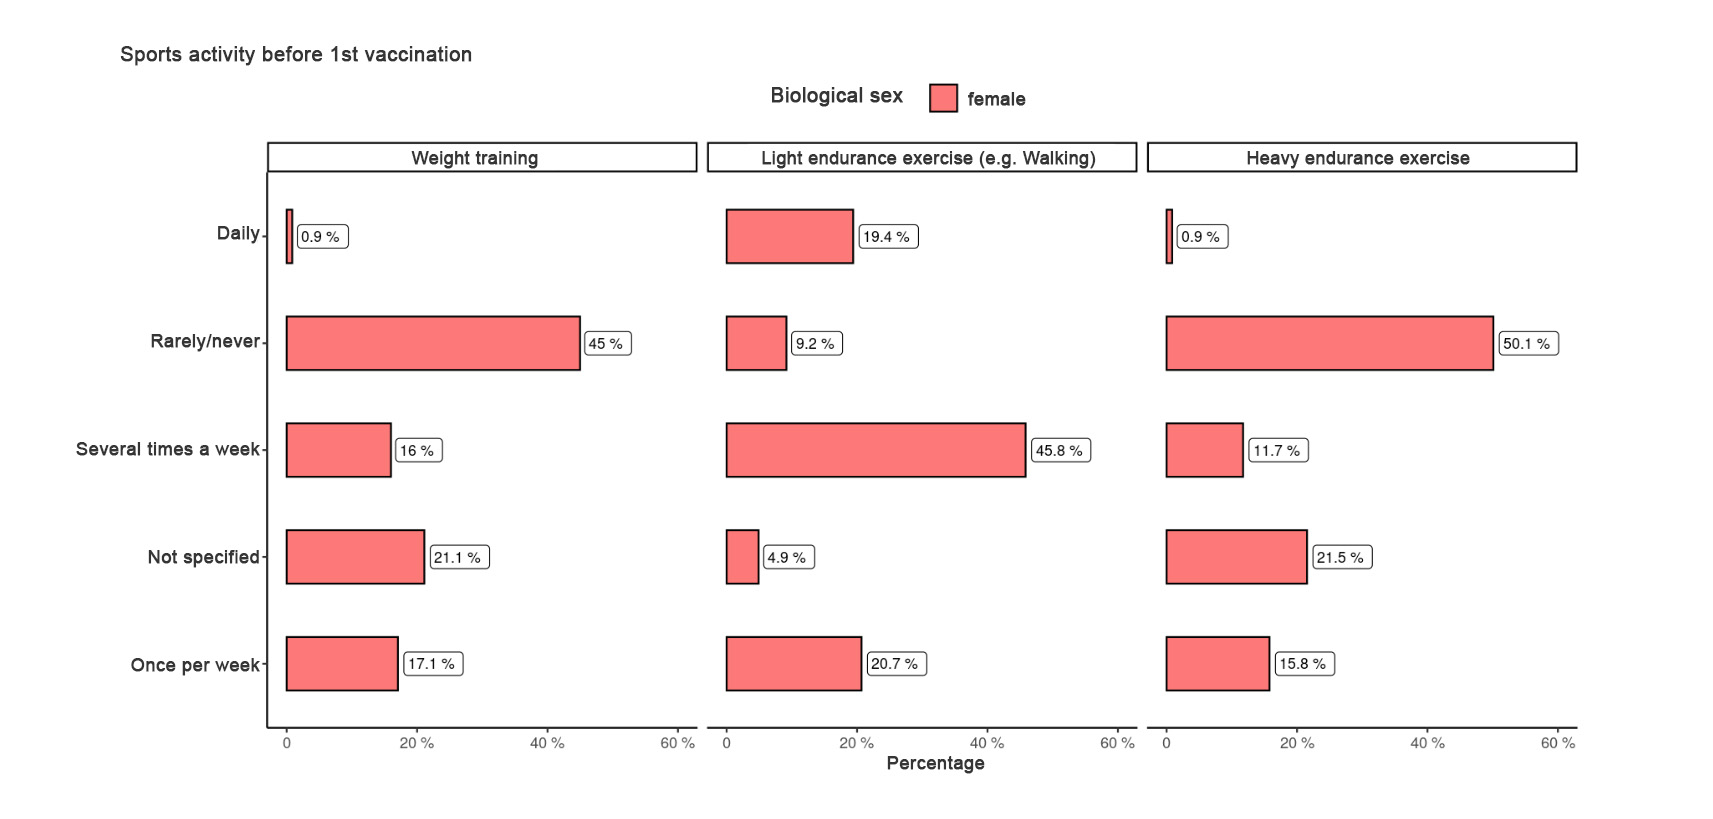
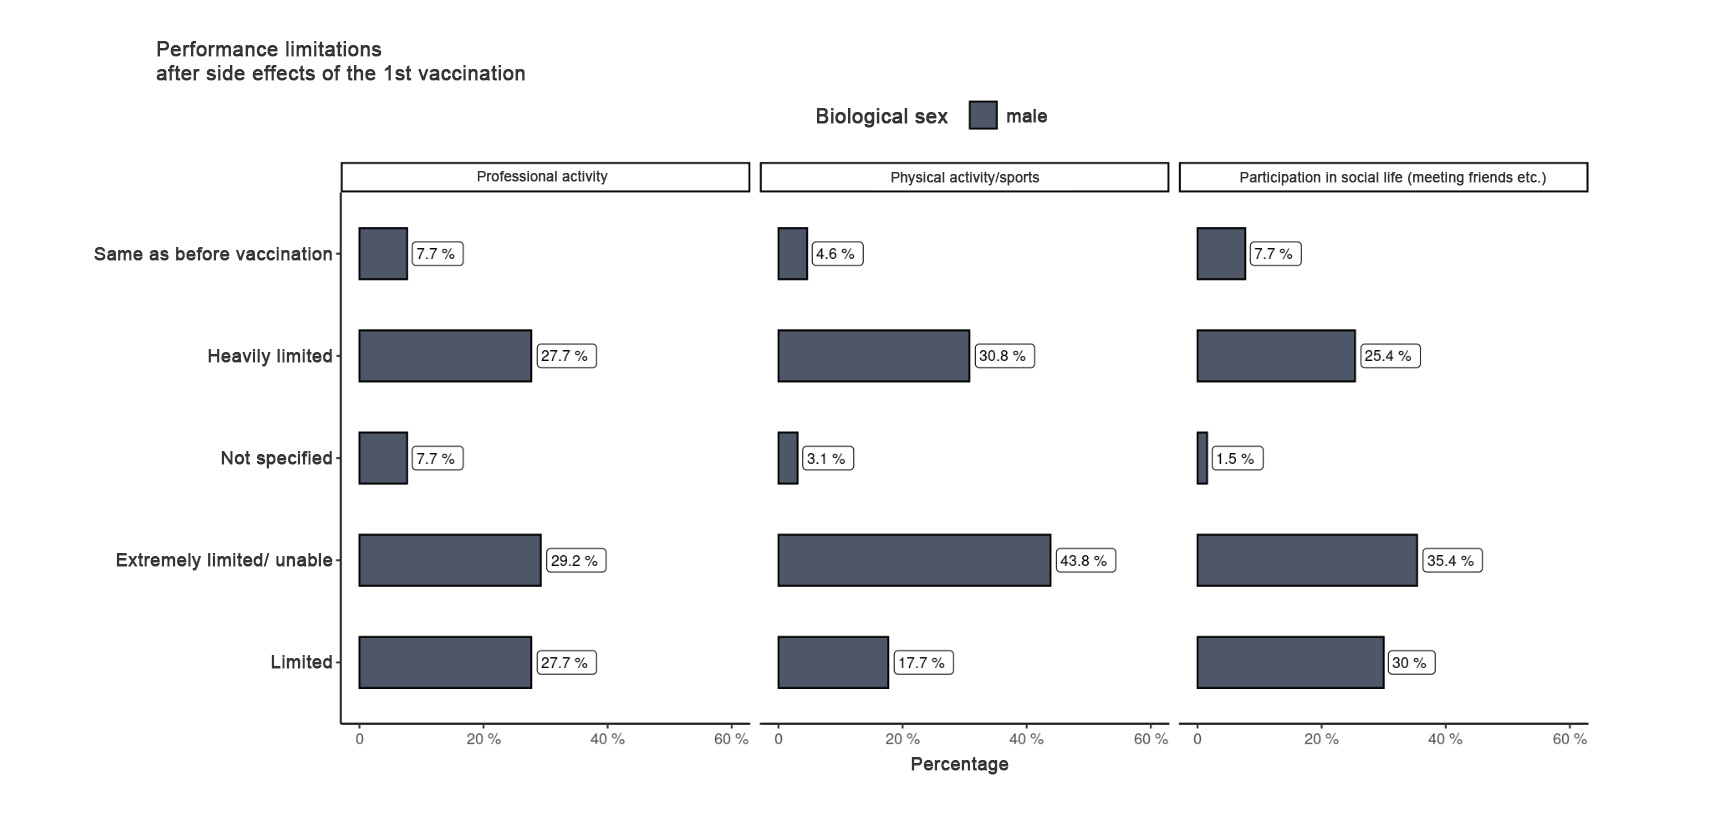
5.6. Performance limitation after 1st vaccination
n=599 Reading example: 33.5% of women describe themselves as "Heavily limited" in their participation in social life after vaccination. 28.6% even as "unable".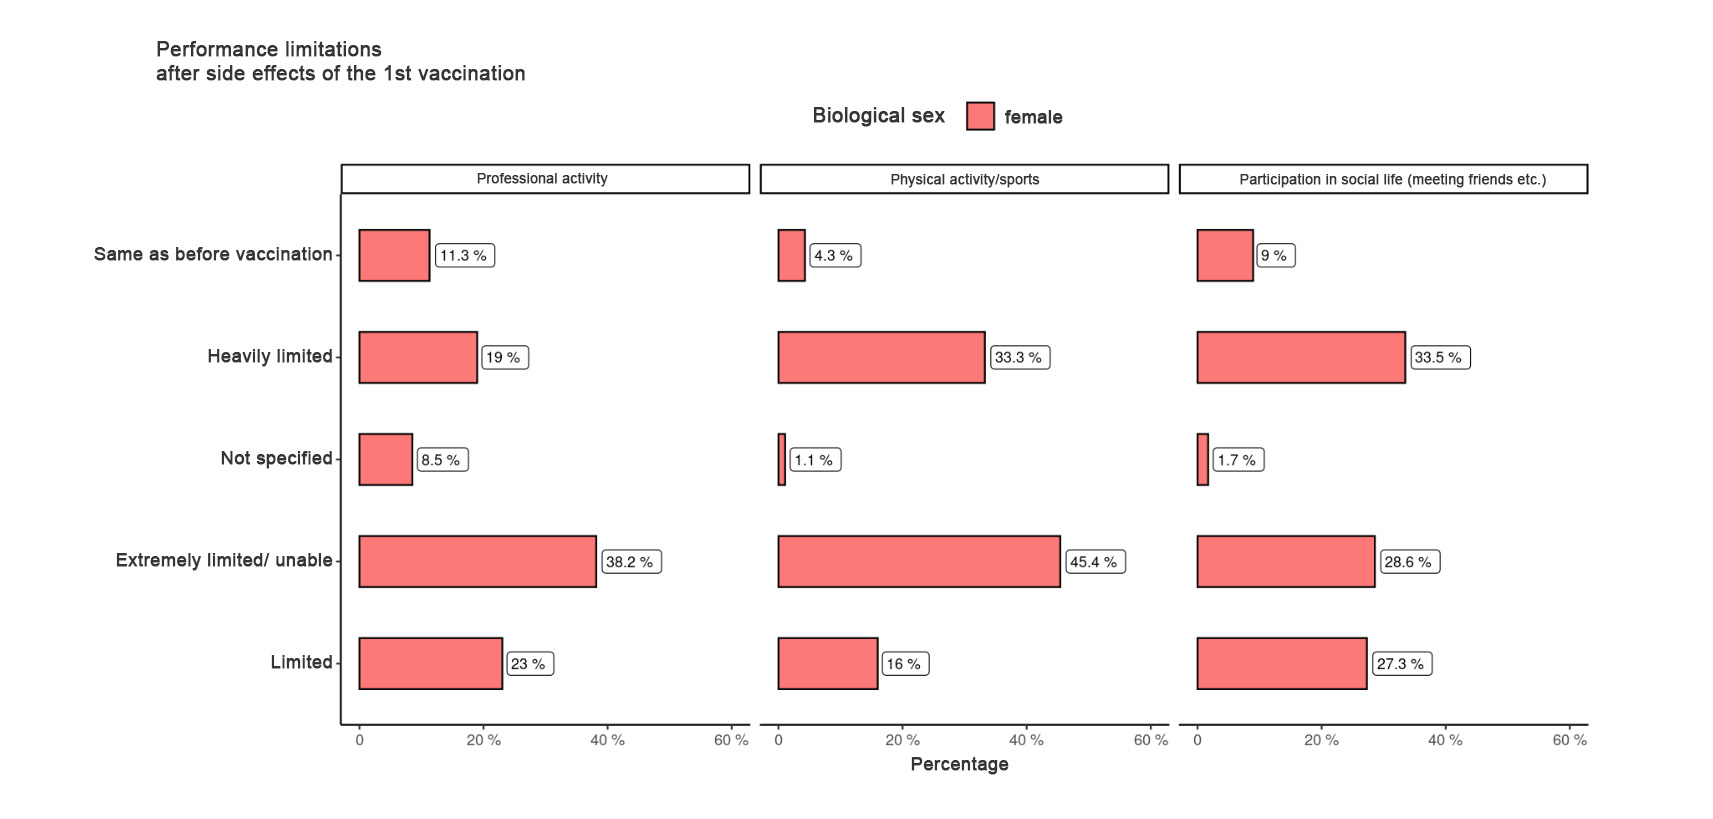
 ** React 19 or Post Vac Syndrome do not diagnose medical conditions, offer treatment advice, treat illnesses, or prescribe medicine or drugs. Any information contained on this website and its related links is not a substitute for adequate medical care, diagnosis, and/or treatment from a medical doctor. It is strongly recommended that prior to acting upon any information gleaned via React 19 or its representatives, you at all times first consult a physician.